SunTrust 2014 Annual Report Download - page 122
Download and view the complete annual report
Please find page 122 of the 2014 SunTrust annual report below. You can navigate through the pages in the report by either clicking on the pages listed below, or by using the keyword search tool below to find specific information within the annual report.-
 1
1 -
2
-
3
-
4
-
5
-
6
-
7
-
8
-
9
-
10
-
11
-
12
-
13
-
14
-
15
-
16
-
17
-
18
-
19
-
20
-
21
-
22
-
23
-
24
-
25
-
26
-
27
-
28
-
29
-
30
-
31
-
32
-
33
-
34
-
35
-
36
-
37
-
38
-
39
-
40
-
41
-
42
-
43
-
44
-
45
-
46
-
47
-
48
-
49
-
50
-
51
-
52
-
53
-
54
-
55
-
56
-
57
-
58
-
59
-
60
-
61
-
62
-
63
-
64
-
65
-
66
-
67
-
68
-
69
-
70
-
71
-
72
-
73
-
74
-
75
-
76
-
77
-
78
-
79
-
80
-
81
-
82
-
83
-
84
-
85
-
86
-
87
-
88
-
89
-
90
-
91
-
92
-
93
-
94
-
95
-
96
-
97
-
98
-
99
-
100
-
101
-
102
-
103
-
104
-
105
-
106
-
107
-
108
-
109
-
110
-
111
-
 112
112 -
 113
113 -
 114
114 -
 115
115 -
 116
116 -
 117
117 -
 118
118 -
 119
119 -
 120
120 -
 121
121 -
 122
122 -
 123
123 -
 124
124 -
 125
125 -
 126
126 -
 127
127 -
 128
128 -
 129
129 -
 130
130 -
 131
131 -
 132
132 -
133
-
134
-
135
-
136
-
137
-
138
-
139
-
140
-
141
-
142
-
143
-
144
-
145
-
146
-
147
-
148
-
149
-
150
-
151
-
152
-
153
-
154
-
155
-
156
-
157
-
158
-
159
-
160
-
161
-
162
-
163
-
164
-
165
-
166
-
167
-
168
-
169
-
170
-
171
-
172
-
173
-
174
-
175
-
176
-
177
-
178
-
179
-
180
-
181
-
182
-
183
-
184
-
185
-
186
-
187
-
188
-
189
-
190
-
191
-
192
-
193
-
194
-
195
-
196
-
197
-
198
-
199
 |
 |

Notes to Consolidated Financial Statements, continued
99
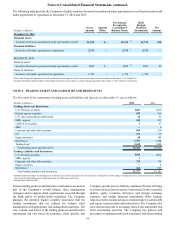
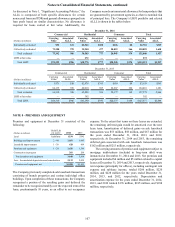
certain. Commercial risk ratings are refreshed at least
annually, or more frequently as appropriate, based upon
considerations such as market conditions, borrower
characteristics, and portfolio trends. Additionally, management
routinely reviews portfolio risk ratings, trends, and
concentrations to support risk identification and mitigation
activities.
For consumer and residential loans, the Company monitors
credit risk based on indicators such as delinquencies and FICO
scores. The Company believes that consumer credit risk, as
assessed by the industry-wide FICO scoring method, is a
relevant credit quality indicator. Borrower-specific FICO
scores are obtained at origination as part of the Company’s
formal underwriting process, and refreshed FICO scores are
obtained by the Company at least quarterly.
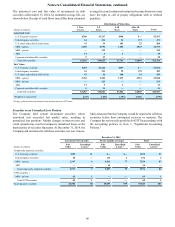
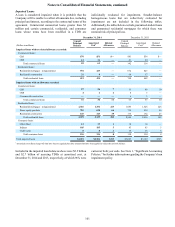
For government-guaranteed loans, the Company monitors
the credit quality based primarily on delinquency status, as it
is a more relevant indicator of credit quality due to the
government guarantee. At December 31, 2014 and 2013, 28%
and 82%, respectively, of the guaranteed residential loan
portfolio was current with respect to payments. The decline in
the percentage of current loans in LHFI is solely due to the sale
of approximately $2.0 billion in accruing current guaranteed
residential loans in the third quarter of 2014. At December 31,
2014 and 2013, 79% and 81%, respectively, of the guaranteed
student loan portfolio was current with respect to payments.
Loss exposure to the Company on these loans is mitigated by
the government guarantee.
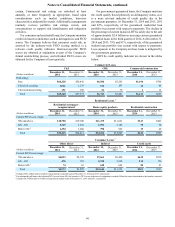
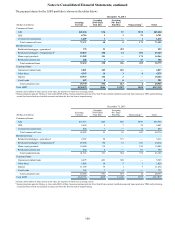
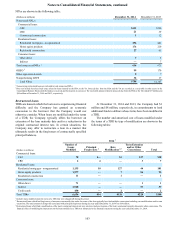
LHFI by credit quality indicator are shown in the tables
below:
Commercial Loans
C&I CRE Commercial construction
(Dollars in millions) December 31,
2014 December 31,
2013 December 31,
2014 December 31,
2013 December 31,
2014 December 31,
2013
Risk rating:
Pass $64,228 $56,443 $6,586 $5,245 $1,196 $798
Criticized accruing 1,061 1,335 134 197 14 45
Criticized nonaccruing 151 196 21 39 112
Total $65,440 $57,974 $6,741 $5,481 $1,211 $855
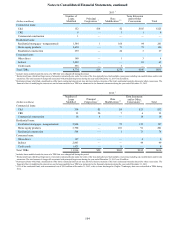
Residential Loans 1
Residential mortgages -
nonguaranteed Home equity products Residential construction
(Dollars in millions) December 31,
2014 December 31,
2013 December 31,
2014 December 31,
2013 December 31,
2014 December 31,
2013
Current FICO score range:
700 and above $18,780 $19,100 $11,475 $11,661 $347 $423
620 - 699 3,369 3,652 1,991 2,186 70 90
Below 620 21,294 1,660 798 962 19 40
Total $23,443 $24,412 $14,264 $14,809 $436 $553
Consumer Loans 3
Other direct Indirect Credit cards
(Dollars in millions) December 31,
2014 December 31,
2013 December 31,
2014 December 31,
2013 December 31,
2014 December 31,
2013
Current FICO score range:
700 and above $4,023 $2,370 $7,661 $8,420 $639 $512
620 - 699 476 397 2,335 2,228 212 176
Below 620 274 62 648 624 50 43
Total $4,573 $2,829 $10,644 $11,272 $901 $731
1 Excludes $632 million and $3.4 billion of guaranteed residential loans at December 31, 2014 and 2013, respectively.
2 For substantially all loans with refreshed FICO scores below 620, the borrower’s FICO score at the time of origination exceeded 620 but has since deteriorated as the loan has seasoned.
3 Excludes $4.8 billion and $5.5 billion of guaranteed student loans at December 31, 2014 and 2013, respectively.