SunTrust 2014 Annual Report Download - page 63
Download and view the complete annual report
Please find page 63 of the 2014 SunTrust annual report below. You can navigate through the pages in the report by either clicking on the pages listed below, or by using the keyword search tool below to find specific information within the annual report.-
 1
1 -
2
-
3
-
4
-
5
-
6
-
7
-
8
-
9
-
10
-
11
-
12
-
13
-
14
-
15
-
16
-
17
-
18
-
19
-
20
-
21
-
22
-
23
-
24
-
25
-
26
-
27
-
28
-
29
-
30
-
31
-
32
-
33
-
34
-
35
-
36
-
37
-
38
-
39
-
40
-
41
-
42
-
43
-
44
-
45
-
46
-
47
-
48
-
49
-
50
-
51
-
52
-
 53
53 -
 54
54 -
 55
55 -
 56
56 -
 57
57 -
 58
58 -
 59
59 -
 60
60 -
 61
61 -
 62
62 -
 63
63 -
 64
64 -
 65
65 -
 66
66 -
 67
67 -
 68
68 -
 69
69 -
 70
70 -
 71
71 -
 72
72 -
 73
73 -
74
-
75
-
76
-
77
-
78
-
79
-
80
-
81
-
82
-
83
-
84
-
85
-
86
-
87
-
88
-
89
-
90
-
91
-
92
-
93
-
94
-
95
-
96
-
97
-
98
-
99
-
100
-
101
-
102
-
103
-
104
-
105
-
106
-
107
-
108
-
109
-
110
-
111
-
112
-
113
-
114
-
115
-
116
-
117
-
118
-
119
-
120
-
121
-
122
-
123
-
124
-
125
-
126
-
127
-
128
-
129
-
130
-
131
-
132
-
133
-
134
-
135
-
136
-
137
-
138
-
139
-
140
-
141
-
142
-
143
-
144
-
145
-
146
-
147
-
148
-
149
-
150
-
151
-
152
-
153
-
154
-
155
-
156
-
157
-
158
-
159
-
160
-
161
-
162
-
163
-
164
-
165
-
166
-
167
-
168
-
169
-
170
-
171
-
172
-
173
-
174
-
175
-
176
-
177
-
178
-
179
-
180
-
181
-
182
-
183
-
184
-
185
-
186
-
187
-
188
-
189
-
190
-
191
-
192
-
193
-
194
-
195
-
196
-
197
-
198
-
199
 |
 |
40
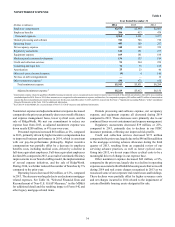
growth. However, the ultimate level of reserves and provision
will continue to be determined by our quarterly review processes,
which consider credit quality trends and risks associated with
our LHFI portfolio, including historical loss experience,
expected loss calculations, delinquencies, performing status,
size and composition of the loan portfolio, and concentrations
within the portfolio, combined with a view on economic
conditions. Despite the improvement in many credit quality
metrics, the ALLL level is also impacted by other indicators of
credit risk associated with the portfolio, such as geopolitical risks
and the increasing availability of credit and resultant higher
levels of leverage for consumers and commercial borrowers. See
"Critical Accounting Policies," in this Form 10-K for additional
information related to ALLL.
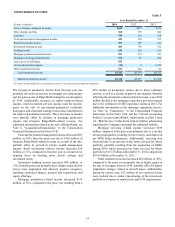
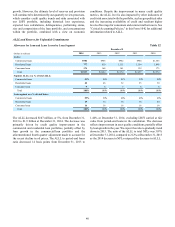
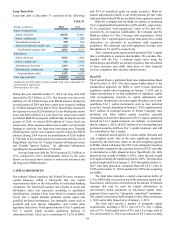
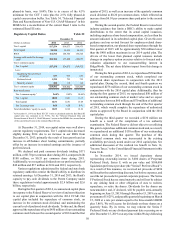
ALLL and Reserve for Unfunded Commitments
Allowance for Loan and Lease Losses by Loan Segment Table 12
December 31
(Dollars in millions) 2014 2013 2012 2011 2010
ALLL:
Commercial loans $986 $946 $902 $964 $1,303
Residential loans 777 930 1,131 1,354 1,498
Consumer loans 174 168 141 139 173
Total $1,937 $2,044 $2,174 $2,457 $2,974
Segment ALLL as a % of total ALLL:
Commercial loans 51% 46% 41% 39% 44%
Residential loans 40 46 52 55 50
Consumer loans 98 7 6 6
Total 100% 100% 100% 100% 100%
Loan segment as a % of total loans:
Commercial loans 55% 50% 48% 46% 46%
Residential loans 29 34 36 38 40
Consumer loans 16 16 16 16 14
Total 100% 100% 100% 100% 100%
The ALLL decreased $107 million, or 5%, from December 31,
2013 to $1.9 billion at December 31, 2014. The decrease was
primarily driven by credit quality improvement in the
commercial and residential loan portfolios, partially offset by
loan growth in the commercial loan portfolio and the
aforementioned fourth quarter adjustment made to account for
the recent decline in oil prices. The ALLL to period-end loans
ratio decreased 14 basis points from December 31, 2013 to
1.46% at December 31, 2014, excluding LHFI carried at fair
value from period-end loans in the calculation. The decrease
reflects improvement in asset quality conditions, partially offset
by loan growth in the year. We expect the ratio to gradually trend
down in 2015. The ratio of the ALLL to total NPLs was 307%
at December 31, 2014, compared to 212% at December 31, 2013
as the 2014 decrease in NPLs outpaced the decrease in ALLL.