SunTrust 2014 Annual Report Download - page 120
Download and view the complete annual report
Please find page 120 of the 2014 SunTrust annual report below. You can navigate through the pages in the report by either clicking on the pages listed below, or by using the keyword search tool below to find specific information within the annual report.-
 1
1 -
2
-
3
-
4
-
5
-
6
-
7
-
8
-
9
-
10
-
11
-
12
-
13
-
14
-
15
-
16
-
17
-
18
-
19
-
20
-
21
-
22
-
23
-
24
-
25
-
26
-
27
-
28
-
29
-
30
-
31
-
32
-
33
-
34
-
35
-
36
-
37
-
38
-
39
-
40
-
41
-
42
-
43
-
44
-
45
-
46
-
47
-
48
-
49
-
50
-
51
-
52
-
53
-
54
-
55
-
56
-
57
-
58
-
59
-
60
-
61
-
62
-
63
-
64
-
65
-
66
-
67
-
68
-
69
-
70
-
71
-
72
-
73
-
74
-
75
-
76
-
77
-
78
-
79
-
80
-
81
-
82
-
83
-
84
-
85
-
86
-
87
-
88
-
89
-
90
-
91
-
92
-
93
-
94
-
95
-
96
-
97
-
98
-
99
-
100
-
101
-
102
-
103
-
104
-
105
-
106
-
107
-
108
-
109
-
 110
110 -
 111
111 -
 112
112 -
 113
113 -
 114
114 -
 115
115 -
 116
116 -
 117
117 -
 118
118 -
 119
119 -
 120
120 -
 121
121 -
 122
122 -
 123
123 -
 124
124 -
 125
125 -
 126
126 -
 127
127 -
 128
128 -
 129
129 -
 130
130 -
131
-
132
-
133
-
134
-
135
-
136
-
137
-
138
-
139
-
140
-
141
-
142
-
143
-
144
-
145
-
146
-
147
-
148
-
149
-
150
-
151
-
152
-
153
-
154
-
155
-
156
-
157
-
158
-
159
-
160
-
161
-
162
-
163
-
164
-
165
-
166
-
167
-
168
-
169
-
170
-
171
-
172
-
173
-
174
-
175
-
176
-
177
-
178
-
179
-
180
-
181
-
182
-
183
-
184
-
185
-
186
-
187
-
188
-
189
-
190
-
191
-
192
-
193
-
194
-
195
-
196
-
197
-
198
-
199
 |
 |

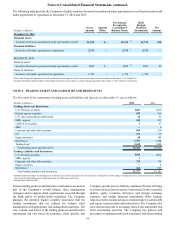
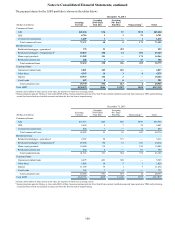
Notes to Consolidated Financial Statements, continued
97
December 31, 2013
Less than twelve months Twelve months or longer Total
(Dollars in millions) Fair
Value Unrealized
Losses 2Fair
Value Unrealized
Losses Fair
Value Unrealized
Losses
Temporarily impaired securities:
U.S. Treasury securities $1,036 $47 $— $— $1,036 $47
Federal agency securities 398 29 264 28 662 57
U.S. states and political subdivisions 12 — 20 2 32 2
MBS - agency 9,173 358 618 67 9,791 425
ABS — — 13 1 13 1
Total temporarily impaired securities 10,619 434 915 98 11,534 532
OTTI securities 1:
MBS - private 105 2 — — 105 2
Total OTTI securities 105 2 — — 105 2
Total impaired securities $10,724 $436 $915 $98 $11,639 $534
1 Includes OTTI securities for which credit losses have been recorded in earnings in current or prior periods.
2 Unrealized losses less than $0.5 million are shown as zero.
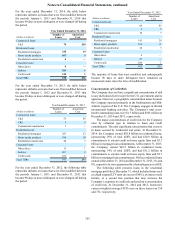
At December 31, 2014, unrealized losses on securities that have
been in a temporarily impaired position for longer than twelve
months included agency MBS, federal agency securities, and one
ABS collateralized by 2004 vintage home equity loans.
Unrealized losses on federal agency securities and agency MBS
securities at December 31, 2014 are due to an increase in market
interest rates exceeding the securities stated yield. The ABS
continues to receive timely principal and interest payments, and
is evaluated quarterly for credit impairment. Cash flow analysis
shows that the underlying collateral can withstand highly
stressed loss assumptions without incurring a credit loss.
The portion of unrealized losses on OTTI securities that
relates to factors other than credit is recorded in AOCI. Losses
related to credit impairment on these securities are determined
through estimated cash flow analyses and have been recorded in
earnings in current or prior periods.
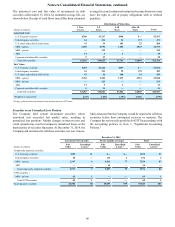
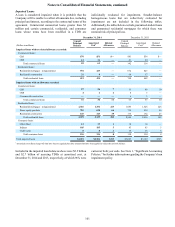
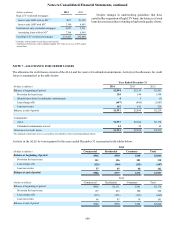
Realized Gains and Losses and Other-than-Temporarily
Impaired Securities
Year Ended December 31
(Dollars in millions) 2014 2013 2012
Gross realized gains $28 $39 $1,981
Gross realized losses (42) (36) —
OTTI losses recognized in earnings (1) (1) (7)
Net securities (losses)/gains ($15) $2 $1,974
Credit impairment that is determined through the use of models
is estimated using cash flows on security specific collateral and
the transaction structure. Future expected credit losses are
determined by using various assumptions, the most significant
of which include default rates, prepayment rates, and loss
severities. If, based on this analysis, the security is in an
unrealized loss position and the Company does not expect to
recover the entire amortized cost basis of the security, the
expected cash flows are then discounted at the security’s initial
effective interest rate to arrive at a present value amount. OTTI
credit losses reflect the difference between the present value of
cash flows expected to be collected and the amortized cost basis
of these securities. During the years ended December 31, 2014,
2013, and 2012, all OTTI recognized in earnings related to
private MBS collateralized by residential mortgage loans
securitized in 2007 or ABS collateralized by 2004 vintage home
equity loans.
The Company continues to reduce existing exposure to these
securities primarily through paydowns. In certain instances, the
amount of impairment losses recognized in earnings includes
credit losses on debt securities that exceeds the total unrealized
losses, and as a result, the securities may have unrealized gains
in AOCI relating to factors other than credit. Subsequent credit
losses may be recorded on securities without a corresponding
further decline in fair value when there has been a decline in
expected cash flows.
Credit impairment recognized on securities was immaterial
during the years ended December 31, 2014, 2013, and 2012. The
ending balance of credit losses recognized in earnings on
securities for which a portion of OTTI was recognized in OCI
as of the end of each period end was $25 million, $25 million,
and $31 million for the years ended December 31, 2014, 2013,
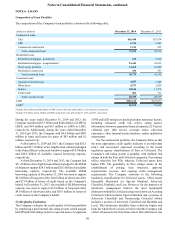
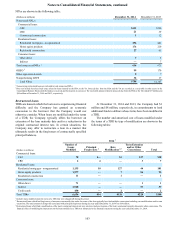
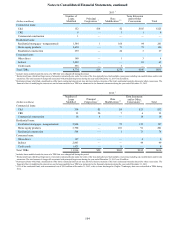
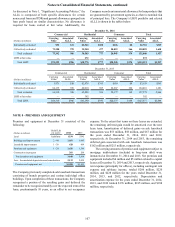
and 2012, respectively. The following table presents a summary
of the significant inputs used in determining the measurement
of credit losses recognized in earnings for private MBS and ABS
for the year ended December 31:
2014 1 2013 2012
Default rate 2% 2 - 9% 2 - 9%
Prepayment rate 16% 7 - 21% 7 - 21%
Loss severity 46% 46 - 74% 40 - 56%
1 During the year ended December 31, 2014, all OTTI recognized in earnings related to one
private MBS security with a fair value of approximately $16 million at December 31,
2014.
Assumption ranges represent the lowest and highest lifetime
average estimates of each security for which credit losses were
recognized in earnings. Ranges may vary from period to period
as the securities for which credit losses are recognized vary.
Additionally, severity may vary widely when losses are few and
large.