SunTrust 2014 Annual Report Download - page 56
Download and view the complete annual report
Please find page 56 of the 2014 SunTrust annual report below. You can navigate through the pages in the report by either clicking on the pages listed below, or by using the keyword search tool below to find specific information within the annual report.-
 1
1 -
2
-
3
-
4
-
5
-
6
-
7
-
8
-
9
-
10
-
11
-
12
-
13
-
14
-
15
-
16
-
17
-
18
-
19
-
20
-
21
-
22
-
23
-
24
-
25
-
26
-
27
-
28
-
29
-
30
-
31
-
32
-
33
-
34
-
35
-
36
-
37
-
38
-
39
-
40
-
41
-
42
-
43
-
44
-
45
-
 46
46 -
 47
47 -
 48
48 -
 49
49 -
 50
50 -
 51
51 -
 52
52 -
 53
53 -
 54
54 -
 55
55 -
 56
56 -
 57
57 -
 58
58 -
 59
59 -
 60
60 -
 61
61 -
 62
62 -
 63
63 -
 64
64 -
 65
65 -
 66
66 -
67
-
68
-
69
-
70
-
71
-
72
-
73
-
74
-
75
-
76
-
77
-
78
-
79
-
80
-
81
-
82
-
83
-
84
-
85
-
86
-
87
-
88
-
89
-
90
-
91
-
92
-
93
-
94
-
95
-
96
-
97
-
98
-
99
-
100
-
101
-
102
-
103
-
104
-
105
-
106
-
107
-
108
-
109
-
110
-
111
-
112
-
113
-
114
-
115
-
116
-
117
-
118
-
119
-
120
-
121
-
122
-
123
-
124
-
125
-
126
-
127
-
128
-
129
-
130
-
131
-
132
-
133
-
134
-
135
-
136
-
137
-
138
-
139
-
140
-
141
-
142
-
143
-
144
-
145
-
146
-
147
-
148
-
149
-
150
-
151
-
152
-
153
-
154
-
155
-
156
-
157
-
158
-
159
-
160
-
161
-
162
-
163
-
164
-
165
-
166
-
167
-
168
-
169
-
170
-
171
-
172
-
173
-
174
-
175
-
176
-
177
-
178
-
179
-
180
-
181
-
182
-
183
-
184
-
185
-
186
-
187
-
188
-
189
-
190
-
191
-
192
-
193
-
194
-
195
-
196
-
197
-
198
-
199
 |
 |

33
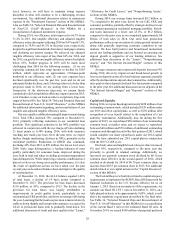
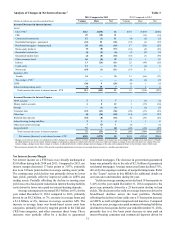
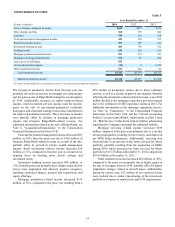
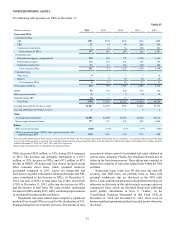
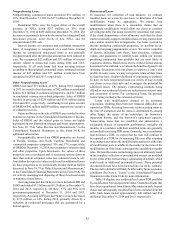
NONINTEREST INCOME Table 5
Year Ended December 31
(Dollars in millions) 2014 2013 2012
Service charges on deposit accounts $645 $657 $676
Other charges and fees 368 369 402
Card fees 320 310 316
Trust and investment management income 423 518 512
Retail investment services 297 267 241
Investment banking income 404 356 342
Trading income 182 182 211
Mortgage production related income 201 314 343
Mortgage servicing related income 196 87 260
Gain on sale of subsidiary 105 — —
Net securities (losses)/gains (15) 2 1,974
Other noninterest income 197 152 96
Total noninterest income $3,323 $3,214 $5,373
Adjusted noninterest income 1$3,218 $3,277 $3,898
1 See Table 34 in this MD&A for a reconcilement of Non-U.S. GAAP measures and additional information.
The increase in noninterest income from the prior year was
primarily driven by an increase in mortgage servicing income
and the gain on sale of RidgeWorth during the second quarter
of 2014. Additionally, increases in capital markets-related
income, retail investment services income, card fee income,
gains on the sale of government-guaranteed residential
mortgages, and structured leasing revenue also contributed to
the improved noninterest income. These increases in income
were partially offset by declines in mortgage production
income and foregone RidgeWorth-related revenue. For
additional information related to the sale of RidgeWorth, see
Note 2, "Acquisitions/Dispositions," to the Consolidated
Financial Statements in this Form 10-K.
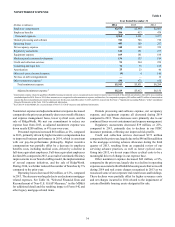
Trust and investment management income decreased $95
million, or 18%, from the prior year due to $102 million of
foregone RidgeWorth-related revenue as a result of the sale,
partially offset by growth in private wealth management
income. Retail investment services income increased $30
million, or 11%, compared to the prior year as a result of our
ongoing focus on meeting more clients’ savings and
investment needs.
Investment banking income increased $48 million, or
13%, from the prior year primarily due to higher client activity
across most origination and advisory product categories,
including syndicated finance, mergers and acquisitions, and
equity offerings.
Mortgage production related income decreased $113
million, or 36%, compared to the prior year resulting from a
45% decline in production volume due to lower refinance
activity, as well as a decline in gain on sale margins. Partially
offsetting the production volume related decrease, was a $102
million decline in the mortgage repurchase provision largely
due to the settlement of GSE repurchase claims in 2013. For
additional information on the mortgage repurchase reserve,
see Note 16, "Guarantees," to the Consolidated Financial
Statements in this Form 10-K and the "Critical Accounting
Policies" section in this MD&A. Additionally, see Part I, Item
1A, "Risk Factors," in this Form 10-K for further information
regarding the Company's potential for additional liability.
Mortgage servicing related income increased $109
million compared to the prior year primarily due to a decline
in loan prepayments, resulting in lower decay, and improved
net MSR hedge performance. Additionally, servicing fees
increased due to an increase in the loans serviced for others
portfolio, partially resulting from the acquisition of MSRs
during 2014, which increased the loans serviced for others
portfolio to $115.5 billion at December 31, 2014 compared to
$106.8 billion at December 31, 2013.
Other noninterest income increased $45 million, or 30%,
compared to the prior year primarily due to higher gains on
the sale of mortgage loans in 2014, partially offset by higher
impairment charges related to aircraft leases. Additionally,
during the current year, $15 million of net securities losses
were realized due to minor repositioning of the investment
portfolio in response to market rates and LCR requirements.