SunTrust 2014 Annual Report Download - page 76
Download and view the complete annual report
Please find page 76 of the 2014 SunTrust annual report below. You can navigate through the pages in the report by either clicking on the pages listed below, or by using the keyword search tool below to find specific information within the annual report.-
 1
1 -
2
-
3
-
4
-
5
-
6
-
7
-
8
-
9
-
10
-
11
-
12
-
13
-
14
-
15
-
16
-
17
-
18
-
19
-
20
-
21
-
22
-
23
-
24
-
25
-
26
-
27
-
28
-
29
-
30
-
31
-
32
-
33
-
34
-
35
-
36
-
37
-
38
-
39
-
40
-
41
-
42
-
43
-
44
-
45
-
46
-
47
-
48
-
49
-
50
-
51
-
52
-
53
-
54
-
55
-
56
-
57
-
58
-
59
-
60
-
61
-
62
-
63
-
64
-
65
-
 66
66 -
 67
67 -
 68
68 -
 69
69 -
 70
70 -
 71
71 -
 72
72 -
 73
73 -
 74
74 -
 75
75 -
 76
76 -
 77
77 -
 78
78 -
 79
79 -
 80
80 -
 81
81 -
 82
82 -
 83
83 -
 84
84 -
 85
85 -
 86
86 -
87
-
88
-
89
-
90
-
91
-
92
-
93
-
94
-
95
-
96
-
97
-
98
-
99
-
100
-
101
-
102
-
103
-
104
-
105
-
106
-
107
-
108
-
109
-
110
-
111
-
112
-
113
-
114
-
115
-
116
-
117
-
118
-
119
-
120
-
121
-
122
-
123
-
124
-
125
-
126
-
127
-
128
-
129
-
130
-
131
-
132
-
133
-
134
-
135
-
136
-
137
-
138
-
139
-
140
-
141
-
142
-
143
-
144
-
145
-
146
-
147
-
148
-
149
-
150
-
151
-
152
-
153
-
154
-
155
-
156
-
157
-
158
-
159
-
160
-
161
-
162
-
163
-
164
-
165
-
166
-
167
-
168
-
169
-
170
-
171
-
172
-
173
-
174
-
175
-
176
-
177
-
178
-
179
-
180
-
181
-
182
-
183
-
184
-
185
-
186
-
187
-
188
-
189
-
190
-
191
-
192
-
193
-
194
-
195
-
196
-
197
-
198
-
199
 |
 |

53
market participants. The objective of fair value is to use market-
based inputs or assumptions, when available, to estimate the
price that would be received to sell an asset or paid to transfer a
liability in an orderly transaction between market participants at
the measurement date. Where observable market prices from
transactions for identical assets or liabilities are not available,
we identify what we believe to be similar assets or liabilities. If
observable market prices are unavailable or impracticable to
obtain for any such similar assets or liabilities, we look to other
techniques by obtaining third party quotes or using modeling
techniques, such as discounted cash flows, while attempting to
utilize market observable assumptions to the extent available.
Absent current market activity in that specific instrument or a
similar instrument, the resulting valuation approach may require
making a number of significant judgments in the estimation of
fair value. Market conditions during the credit crisis led to limited
or nonexistent trading in certain of the financial asset classes that
we have owned. Although market conditions have improved and
we have seen the return of liquidity in certain markets, we
continue to experience a low level of activity in certain markets
and also hold a limited amount of instruments that do not have
an active market, which creates additional challenges when
estimating the fair value of these financial instruments.
Generally, the assets and liabilities most affected by the lack
of liquidity or observable market are those required to be
classified as level 3 in the fair value hierarchy. As a result, various
processes and controls have been adopted to determine that
appropriate methodologies, techniques, and assumptions are
used in the development of fair value estimates, particularly
related to those instruments that require the use of significant,
unobservable inputs. We continue to maintain a cross-functional
approach when estimating the fair value of these difficult to value
financial instruments. This includes input from not only the
related line of business, but also from risk management and
finance, to ultimately arrive at a consensus estimate of the
instrument's fair value after evaluating all available information
pertaining to fair value. This process involves the gathering of
multiple sources of information, including broker quotes, values
provided by pricing services, trading activity in other similar
instruments, market indices, and pricing matrices along with
employing various modeling techniques, such as discounted cash
flow analyses, in arriving at the best estimate of fair value.
Modeling techniques incorporate our assessments regarding
assumptions that market participants would use in pricing the
asset or the liability, including market-based assumptions, such
as interest rates, as well as assumptions about the risks inherent
in a particular valuation technique, the effect of a restriction on
the sale or use of an asset, market liquidity, and the risk of
nonperformance. In certain cases, our assessments with respect
to assumptions that market participants would make may be
inherently difficult to determine, and the use of different
assumptions could result in material changes to these fair value
measurements. We used significant unobservable inputs to fair
value, on a recurring basis, for certain trading assets, securities
AFS, portfolio loans accounted for at fair value, IRLCs, LHFS,
MSRs, and certain derivatives. Overall, the financial impact of
the level 3 financial instruments did not have a material impact
on our liquidity or capital. Our exposure to level 3 financial
instruments continues to decline due to paydowns, sales and
settlements of these instruments, and the fact that we have made
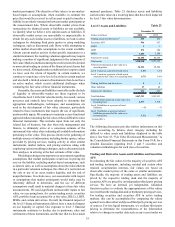
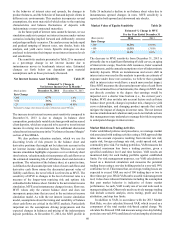
minimal purchases. Table 23 discloses assets and liabilities
carried at fair value on a recurring basis that have been impacted
by level 3 fair value determinations.
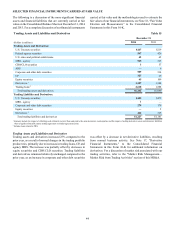
Level 3 Assets and Liabilities Table 23
December 31
(Dollars in millions) 2014 2013
Trading assets and derivatives 1$25 $72
Securities AFS 946 953
LHFS 13
LHFI 272 302
MSRs 1,206 1,300
Total level 3 assets $2,450 $2,630
Total assets $190,328 $175,335
Total assets measured at fair value on a
recurring basis 36,342 30,562
Level 3 assets as a percent of total assets 1.3% 1.5%
Level 3 assets as a percent of total assets
measured at fair value on a recurring basis 6.7% 8.6%
Trading liabilities and derivatives 54
Other liabilities 27 29
Total level 3 liabilities $32 $33
Total liabilities $167,323 $153,913
Total liabilities measured at fair value on a
recurring basis 2,537 3,530
Level 3 liabilities as a percent of total
liabilities —% —%
Level 3 liabilities as a percent of total
liabilities measured at fair value on a
recurring basis 1.3% 0.9%
1 Includes IRLCs.
The following discussion provides further information on fair
value accounting by balance sheet category including the
difficult to value assets and liabilities displayed in the table
above. See Note 18, “Fair Value Election and Measurement,” to
the Consolidated Financial Statements in this Form 10-K for a
detailed discussion regarding level 2 and 3 securities and
valuation methodologies for each class of securities.
Trading and Derivative Assets and Liabilities and Securities
AFS
In estimating the fair values for the majority of securities AFS
and trading instruments, including residual and certain other
retained securitization interests, fair values are based on
observable market prices of the same or similar instruments.
Specifically, the majority of trading assets and liabilities are
priced by the respective trading desk and the majority of
securities AFS are priced by an independent third party pricing
service. We have an internal, yet independent, validation
function in place to evaluate the appropriateness of the values
received from the trading desk and/or third party pricing services.
For trading securities and securities AFS in active trading
markets, this can be accomplished by comparing the values
against two to three other widely used third party pricing services
or sources. For less liquid instruments, we evaluate third party
pricing to determine the reasonableness of the information
relative to changes in market data such as any recent trades we