SunTrust 2014 Annual Report Download - page 130
Download and view the complete annual report
Please find page 130 of the 2014 SunTrust annual report below. You can navigate through the pages in the report by either clicking on the pages listed below, or by using the keyword search tool below to find specific information within the annual report.-
 1
1 -
2
-
3
-
4
-
5
-
6
-
7
-
8
-
9
-
10
-
11
-
12
-
13
-
14
-
15
-
16
-
17
-
18
-
19
-
20
-
21
-
22
-
23
-
24
-
25
-
26
-
27
-
28
-
29
-
30
-
31
-
32
-
33
-
34
-
35
-
36
-
37
-
38
-
39
-
40
-
41
-
42
-
43
-
44
-
45
-
46
-
47
-
48
-
49
-
50
-
51
-
52
-
53
-
54
-
55
-
56
-
57
-
58
-
59
-
60
-
61
-
62
-
63
-
64
-
65
-
66
-
67
-
68
-
69
-
70
-
71
-
72
-
73
-
74
-
75
-
76
-
77
-
78
-
79
-
80
-
81
-
82
-
83
-
84
-
85
-
86
-
87
-
88
-
89
-
90
-
91
-
92
-
93
-
94
-
95
-
96
-
97
-
98
-
99
-
100
-
101
-
102
-
103
-
104
-
105
-
106
-
107
-
108
-
109
-
110
-
111
-
112
-
113
-
114
-
115
-
116
-
117
-
118
-
119
-
 120
120 -
 121
121 -
 122
122 -
 123
123 -
 124
124 -
 125
125 -
 126
126 -
 127
127 -
 128
128 -
 129
129 -
 130
130 -
 131
131 -
 132
132 -
 133
133 -
 134
134 -
 135
135 -
 136
136 -
 137
137 -
 138
138 -
 139
139 -
 140
140 -
141
-
142
-
143
-
144
-
145
-
146
-
147
-
148
-
149
-
150
-
151
-
152
-
153
-
154
-
155
-
156
-
157
-
158
-
159
-
160
-
161
-
162
-
163
-
164
-
165
-
166
-
167
-
168
-
169
-
170
-
171
-
172
-
173
-
174
-
175
-
176
-
177
-
178
-
179
-
180
-
181
-
182
-
183
-
184
-
185
-
186
-
187
-
188
-
189
-
190
-
191
-
192
-
193
-
194
-
195
-
196
-
197
-
198
-
199
 |
 |
Notes to Consolidated Financial Statements, continued
107
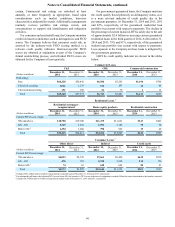
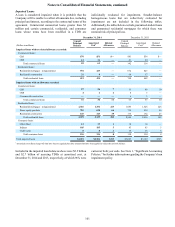
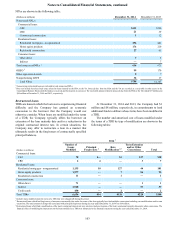
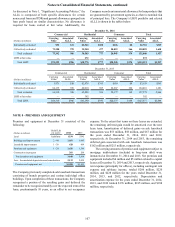
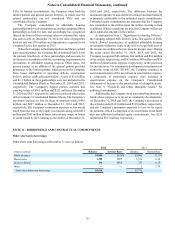
As discussed in Note 1, “Significant Accounting Policies,” the
ALLL is composed of both specific allowances for certain
nonaccrual loans and TDRs and general allowances grouped into
loan pools based on similar characteristics. No allowance is
required for loans carried at fair value. Additionally, the
Company records an immaterial allowance for loan products that
are guaranteed by government agencies, as there is nominal risk
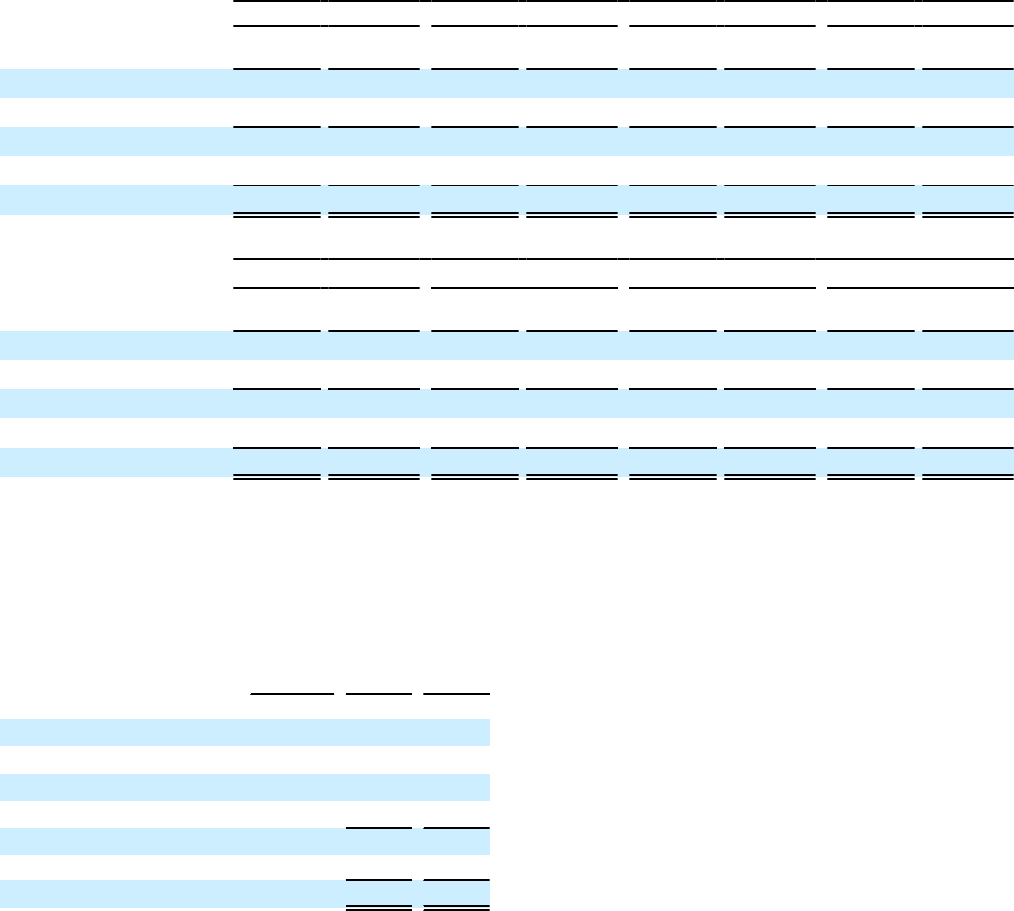
of principal loss. The Company’s LHFI portfolio and related
ALLL is shown in the tables below:
December 31, 2014
Commercial Residential Consumer Total
(Dollars in millions) Carrying
Value Associated
ALLL Carrying
Value Associated
ALLL Carrying
Value Associated
ALLL Carrying
Value Associated
ALLL
Individually evaluated $92 $11 $2,563 $300 $126 $8 $2,781 $319
Collectively evaluated 73,300 975 35,940 477 20,819 166 130,059 1,618
Total evaluated 73,392 986 38,503 777 20,945 174 132,840 1,937
LHFI at fair value — — 272 — — — 272 —
Total LHFI $73,392 $986 $38,775 $777 $20,945 $174 $133,112 $1,937
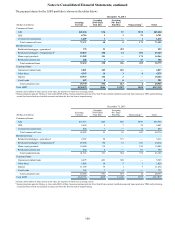
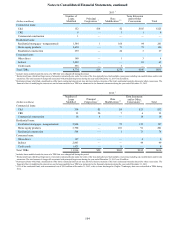
December 31, 2013
Commercial Residential Consumer Total
(Dollars in millions) Carrying
Value Associated
ALLL Carrying
Value Associated
ALLL Carrying
Value Associated
ALLL Carrying
Value Associated
ALLL
Individually evaluated $171 $10 $2,878 $345 $110 $8 $3,159 $363
Collectively evaluated 64,139 936 40,010 585 20,267 160 124,416 1,681
Total evaluated 64,310 946 42,888 930 20,377 168 127,575 2,044
LHFI at fair value — — 302 — — — 302 —
Total LHFI $64,310 $946 $43,190 $930 $20,377 $168 $127,877 $2,044
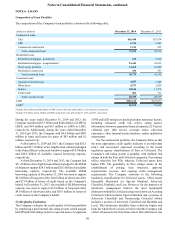
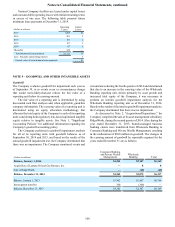
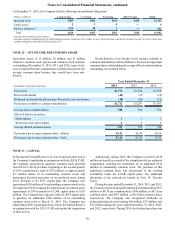
NOTE 8 - PREMISES AND EQUIPMENT
Premises and equipment at December 31 consisted of the
following:
(Dollars in millions) Useful Life
(in years) 2014 2013
Land Indefinite $334 $345
Buildings and improvements 2 - 40 1,051 1,045
Leasehold improvements 1 - 30 628 609
Furniture and equipment 1 - 20 1,426 1,399
Construction in progress 201 206
Total premises and equipment 3,640 3,604
Less: Accumulated depreciation and amortization 2,132 2,039
Premises and equipment, net $1,508 $1,565
The Company previously completed sale leaseback transactions
consisting of branch properties and various individual office
buildings. Upon completion of these transactions, the Company
recognized a portion of the resulting gains and deferred the
remainder to be recognized ratably over the expected term of the
lease, predominantly 10 years, as an offset to net occupancy
expense. To the extent that terms on these leases are extended,
the remaining deferred gain would be amortized over the new
lease term. Amortization of deferred gains on sale leaseback
transactions was $53 million, $58 million, and $67 million for
the years ended December 31, 2014, 2013, and 2012,
respectively. At December 31, 2014 and 2013, the remaining
deferred gain associated with sale leaseback transactions was
$162 million and $215 million, respectively.
The carrying amounts of premises and equipment subject to
mortgage indebtedness (included in long-term debt) were
immaterial at December 31, 2014 and 2013. Net premises and
equipment included $4 million and $5 million related to capital
leases at December 31, 2014 and 2013, respectively. Aggregate
rent expense (principally for offices), including contingent rent
expense and sublease income, totaled $206 million, $220
million, and $228 million for the years ended December 31,
2014, 2013, and 2012, respectively. Depreciation and
amortization expense for the years ended December 31, 2014,
2013, and 2012 totaled $176 million, $185 million, and $188
million, respectively.