SunTrust 2014 Annual Report Download - page 163
Download and view the complete annual report
Please find page 163 of the 2014 SunTrust annual report below. You can navigate through the pages in the report by either clicking on the pages listed below, or by using the keyword search tool below to find specific information within the annual report.-
 1
1 -
2
-
3
-
4
-
5
-
6
-
7
-
8
-
9
-
10
-
11
-
12
-
13
-
14
-
15
-
16
-
17
-
18
-
19
-
20
-
21
-
22
-
23
-
24
-
25
-
26
-
27
-
28
-
29
-
30
-
31
-
32
-
33
-
34
-
35
-
36
-
37
-
38
-
39
-
40
-
41
-
42
-
43
-
44
-
45
-
46
-
47
-
48
-
49
-
50
-
51
-
52
-
53
-
54
-
55
-
56
-
57
-
58
-
59
-
60
-
61
-
62
-
63
-
64
-
65
-
66
-
67
-
68
-
69
-
70
-
71
-
72
-
73
-
74
-
75
-
76
-
77
-
78
-
79
-
80
-
81
-
82
-
83
-
84
-
85
-
86
-
87
-
88
-
89
-
90
-
91
-
92
-
93
-
94
-
95
-
96
-
97
-
98
-
99
-
100
-
101
-
102
-
103
-
104
-
105
-
106
-
107
-
108
-
109
-
110
-
111
-
112
-
113
-
114
-
115
-
116
-
117
-
118
-
119
-
120
-
121
-
122
-
123
-
124
-
125
-
126
-
127
-
128
-
129
-
130
-
131
-
132
-
133
-
134
-
135
-
136
-
137
-
138
-
139
-
140
-
141
-
142
-
143
-
144
-
145
-
146
-
147
-
148
-
149
-
150
-
151
-
152
-
 153
153 -
 154
154 -
 155
155 -
 156
156 -
 157
157 -
 158
158 -
 159
159 -
 160
160 -
 161
161 -
 162
162 -
 163
163 -
 164
164 -
 165
165 -
 166
166 -
 167
167 -
 168
168 -
 169
169 -
 170
170 -
 171
171 -
 172
172 -
 173
173 -
174
-
175
-
176
-
177
-
178
-
179
-
180
-
181
-
182
-
183
-
184
-
185
-
186
-
187
-
188
-
189
-
190
-
191
-
192
-
193
-
194
-
195
-
196
-
197
-
198
-
199
 |
 |

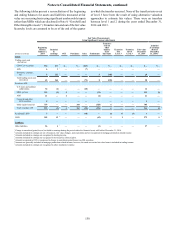
Notes to Consolidated Financial Statements, continued
140
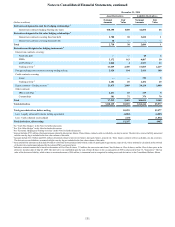
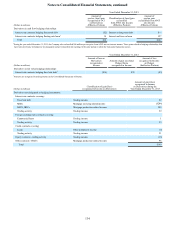
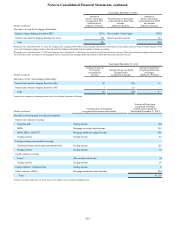
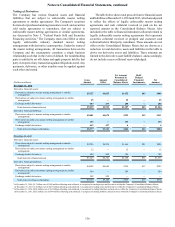
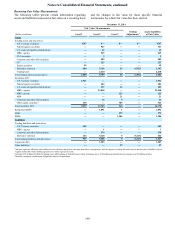
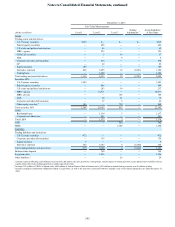
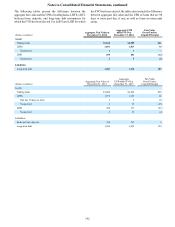
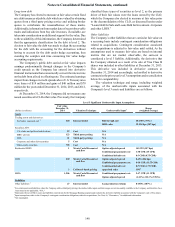
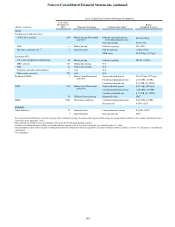
Recurring Fair Value Measurements
The following tables present certain information regarding
assets and liabilities measured at fair value on a recurring basis and the changes in fair value for those specific financial
instruments for which fair value has been elected.
December 31, 2014
Fair Value Measurements
(Dollars in millions) Level 1 Level 2 Level 3 Netting
Adjustments 1Assets/Liabilities
at Fair Value
Assets
Trading assets and derivatives:
U.S. Treasury securities $267 $— $— $— $267
Federal agency securities — 547 — — 547
U.S. states and political subdivisions — 42 — — 42
MBS - agency — 545 — — 545
CLO securities — 3 — — 3
Corporate and other debt securities — 509 — — 509
CP — 327 — — 327
Equity securities 45 — — — 45
Derivative contracts 688 5,126 25 (4,532) 1,307
Trading loans — 2,610 — — 2,610
Total trading assets and derivatives 1,000 9,709 25 (4,532) 6,202
Securities AFS:
U.S. Treasury securities 1,921 — — — 1,921
Federal agency securities — 484 — — 484
U.S. states and political subdivisions — 197 12 — 209
MBS - agency — 23,048 — — 23,048
MBS - private — — 123 — 123
ABS — — 21 — 21
Corporate and other debt securities — 36 5 — 41
Other equity securities 2138 — 785 — 923
Total securities AFS 2,059 23,765 946 — 26,770
Residential LHFS — 1,891 1 — 1,892
LHFI — — 272 — 272
MSRs — — 1,206 — 1,206
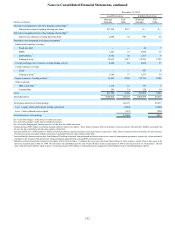
Liabilities
Trading liabilities and derivatives:
U.S. Treasury securities 485 — — — 485
MBS - agency — 1 — — 1
Corporate and other debt securities — 279 — — 279
Derivative contracts 444 5,128 5 (5,115) 462
Total trading liabilities and derivatives 929 5,408 5 (5,115) 1,227
Long-term debt — 1,283 — — 1,283
Other liabilities 3— — 27 — 27
1 Amounts represent offsetting cash collateral received from, and paid to, the same derivative counterparties, and the impact of netting derivative assets and derivative liabilities when a
legally enforceable master netting agreement or similar agreement exists.
2 Includes $376 million of FHLB of Atlanta stock, $402 million of Federal Reserve Bank of Atlanta stock, $138 million in mutual fund investments, and $7 million of other.
3 Includes contingent consideration obligations related to acquisitions.