SunTrust 2014 Annual Report Download - page 176
Download and view the complete annual report
Please find page 176 of the 2014 SunTrust annual report below. You can navigate through the pages in the report by either clicking on the pages listed below, or by using the keyword search tool below to find specific information within the annual report.-
 1
1 -
2
-
3
-
4
-
5
-
6
-
7
-
8
-
9
-
10
-
11
-
12
-
13
-
14
-
15
-
16
-
17
-
18
-
19
-
20
-
21
-
22
-
23
-
24
-
25
-
26
-
27
-
28
-
29
-
30
-
31
-
32
-
33
-
34
-
35
-
36
-
37
-
38
-
39
-
40
-
41
-
42
-
43
-
44
-
45
-
46
-
47
-
48
-
49
-
50
-
51
-
52
-
53
-
54
-
55
-
56
-
57
-
58
-
59
-
60
-
61
-
62
-
63
-
64
-
65
-
66
-
67
-
68
-
69
-
70
-
71
-
72
-
73
-
74
-
75
-
76
-
77
-
78
-
79
-
80
-
81
-
82
-
83
-
84
-
85
-
86
-
87
-
88
-
89
-
90
-
91
-
92
-
93
-
94
-
95
-
96
-
97
-
98
-
99
-
100
-
101
-
102
-
103
-
104
-
105
-
106
-
107
-
108
-
109
-
110
-
111
-
112
-
113
-
114
-
115
-
116
-
117
-
118
-
119
-
120
-
121
-
122
-
123
-
124
-
125
-
126
-
127
-
128
-
129
-
130
-
131
-
132
-
133
-
134
-
135
-
136
-
137
-
138
-
139
-
140
-
141
-
142
-
143
-
144
-
145
-
146
-
147
-
148
-
149
-
150
-
151
-
152
-
153
-
154
-
155
-
156
-
157
-
158
-
159
-
160
-
161
-
162
-
163
-
164
-
165
-
 166
166 -
 167
167 -
 168
168 -
 169
169 -
 170
170 -
 171
171 -
 172
172 -
 173
173 -
 174
174 -
 175
175 -
 176
176 -
 177
177 -
 178
178 -
 179
179 -
 180
180 -
 181
181 -
 182
182 -
 183
183 -
 184
184 -
 185
185 -
 186
186 -
187
-
188
-
189
-
190
-
191
-
192
-
193
-
194
-
195
-
196
-
197
-
198
-
199
 |
 |

Notes to Consolidated Financial Statements, continued
153
equipment dealers, and the discounted cash flows derived from
the underlying lease agreement. As market data for similar assets
and lease arrangements is available and used in the valuation,
these assets are considered level 2. During the years ended
December 31, 2014 and 2013, the Company recognized
impairment charges of $59 million and $50 million, respectively,
attributable to the fair value of various personal property under
operating leases.
Land held for sale is recorded at the lesser of carrying value
or fair value less cost to sell. Land held for sale is considered
level 2 as its fair value is determined based on market
comparables and broker opinions. The Company recognized $5
million in impairment charges on land held for sale during the
year ended December 31, 2014. No impairment charges were
recognized on land held for sale during the year ended December
31, 2013.
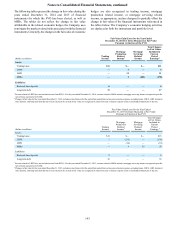
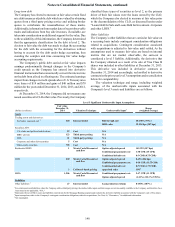
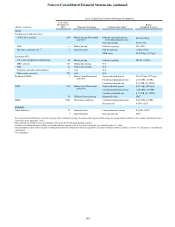
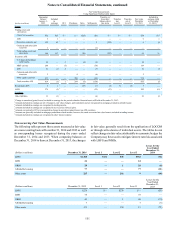
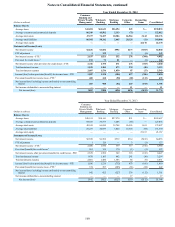
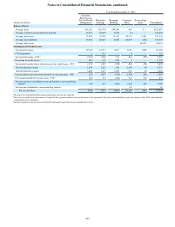
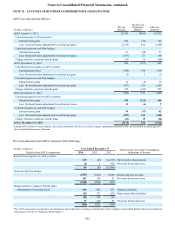
Fair Value of Financial Instruments
The measured amounts and fair values of the Company’s financial instruments are as follows:
December 31, 2014 Fair Value Measurement Using
(Dollars in millions) Measured
Amount Fair
Value Level 1 Level 2 Level 3
Financial assets:
Cash and cash equivalents $8,229 $8,229 $8,229 $— $— (a)
Trading assets and derivatives 6,202 6,202 1,000 5,177 25 (b)
Securities AFS 26,770 26,770 2,059 23,765 946 (b)
LHFS 3,232 3,240 — 2,063 1,177 (c)
LHFI, net 131,175 126,855 — 545 126,310 (d)
Financial liabilities:
Deposits 140,567 140,562 — 140,562 — (e)
Short-term borrowings 9,186 9,186 — 9,186 — (f)
Long-term debt 13,022 13,056 — 12,398 658 (f)
Trading liabilities and derivatives 1,227 1,227 929 293 5 (b)
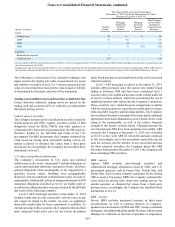
December 31, 2013 Fair Value Measurement Using
(Dollars in millions) Measured
Amount Fair
Value Level 1 Level 2 Level 3
Financial assets:
Cash and cash equivalents $5,263 $5,263 $5,263 $— $— (a)
Trading assets and derivatives 5,040 5,040 1,156 3,812 72 (b)
Securities AFS 22,542 22,542 1,396 20,193 953 (b)
LHFS 1,699 1,700 — 1,666 34 (c)
LHFI, net 125,833 121,341 — 2,860 118,481 (d)
Financial liabilities:
Deposits 129,759 129,801 — 129,801 — (e)
Short-term borrowings 8,739 8,739 — 8,739 — (f)
Long-term debt 10,700 10,678 — 10,086 592 (f)
Trading liabilities and derivatives 1,181 1,181 979 198 4 (b)
The following methods and assumptions were used by the
Company in estimating the fair value of financial instruments:
(a) Cash and cash equivalents are valued at their carrying
amounts reported in the balance sheet, which are reasonable
estimates of fair value due to the relatively short period to
maturity of the instruments.
(b) Trading assets and derivatives, securities AFS, and trading
liabilities and derivatives that are classified as level 1 are
valued based on quoted market prices. For those
instruments classified as level 2 or 3, refer to the respective
valuation discussions within this footnote.
(c) LHFS are generally valued based on observable current
market prices or, if quoted market prices are not available,
on quoted market prices of similar instruments. Refer to the
LHFS section within this footnote for further discussion of
the LHFS carried at fair value. In instances for which
significant valuation assumptions are not readily
observable in the market, instruments are valued based on
the best available data to approximate fair value. This data
may be internally-developed and considers risk premiums
that a market participant would require under then-current
market conditions.
(d) LHFI fair values are based on a hypothetical exit price,
which does not represent the estimated intrinsic value of
the loan if held for investment. The assumptions used are
expected to approximate those that a market participant
purchasing the loans would use to value the loans, including
a market risk premium and liquidity discount. Estimating
the fair value of the loan portfolio when loan sales and
trading markets are illiquid, or for certain loan types,
nonexistent, requires significant judgment. Therefore, the