SunTrust 2014 Annual Report Download - page 66
Download and view the complete annual report
Please find page 66 of the 2014 SunTrust annual report below. You can navigate through the pages in the report by either clicking on the pages listed below, or by using the keyword search tool below to find specific information within the annual report.-
 1
1 -
2
-
3
-
4
-
5
-
6
-
7
-
8
-
9
-
10
-
11
-
12
-
13
-
14
-
15
-
16
-
17
-
18
-
19
-
20
-
21
-
22
-
23
-
24
-
25
-
26
-
27
-
28
-
29
-
30
-
31
-
32
-
33
-
34
-
35
-
36
-
37
-
38
-
39
-
40
-
41
-
42
-
43
-
44
-
45
-
46
-
47
-
48
-
49
-
50
-
51
-
52
-
53
-
54
-
55
-
 56
56 -
 57
57 -
 58
58 -
 59
59 -
 60
60 -
 61
61 -
 62
62 -
 63
63 -
 64
64 -
 65
65 -
 66
66 -
 67
67 -
 68
68 -
 69
69 -
 70
70 -
 71
71 -
 72
72 -
 73
73 -
 74
74 -
 75
75 -
 76
76 -
77
-
78
-
79
-
80
-
81
-
82
-
83
-
84
-
85
-
86
-
87
-
88
-
89
-
90
-
91
-
92
-
93
-
94
-
95
-
96
-
97
-
98
-
99
-
100
-
101
-
102
-
103
-
104
-
105
-
106
-
107
-
108
-
109
-
110
-
111
-
112
-
113
-
114
-
115
-
116
-
117
-
118
-
119
-
120
-
121
-
122
-
123
-
124
-
125
-
126
-
127
-
128
-
129
-
130
-
131
-
132
-
133
-
134
-
135
-
136
-
137
-
138
-
139
-
140
-
141
-
142
-
143
-
144
-
145
-
146
-
147
-
148
-
149
-
150
-
151
-
152
-
153
-
154
-
155
-
156
-
157
-
158
-
159
-
160
-
161
-
162
-
163
-
164
-
165
-
166
-
167
-
168
-
169
-
170
-
171
-
172
-
173
-
174
-
175
-
176
-
177
-
178
-
179
-
180
-
181
-
182
-
183
-
184
-
185
-
186
-
187
-
188
-
189
-
190
-
191
-
192
-
193
-
194
-
195
-
196
-
197
-
198
-
199
 |
 |
43
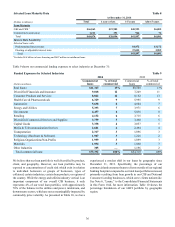
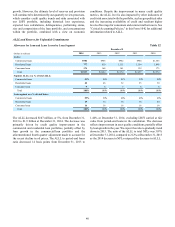
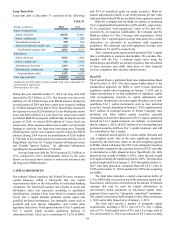
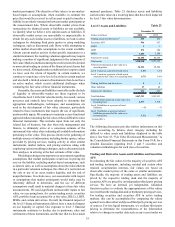
Selected Residential TDR Data Table 14
December 31, 2014
Accruing TDRs Nonaccruing TDRs
(Dollars in millions) Current Delinquent 1Total Current Delinquent 1Total
Rate reduction $784 $69 $853 $16 $40 $56
Term extension 13 4 17 1 1 2
Rate reduction and term extension 1,251 103 1,354 30 68 98
Other 2173 11 184 12 26 38
Total $2,221 $187 $2,408 $59 $135 $194
December 31, 2013
Accruing TDRs Nonaccruing TDRs
(Dollars in millions) Current Delinquent 1 Total Current Delinquent 1 Total
Rate reduction $692 $90 $782 $27 $50 $77
Term extension 17 4 21 1 6 7
Rate reduction and term extension 1,439 135 1,574 27 127 154
Other 2180 13 193 16 54 70
Total $2,328 $242 $2,570 $71 $237 $308
1 TDRs considered delinquent for purposes of this table were those at least thirty days past due.
2 Primarily consists of extensions and deficiency notes.
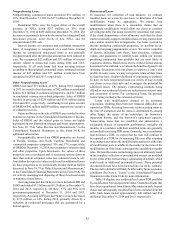
At December 31, 2014, our total TDR portfolio was $2.9
billion and was composed of $2.6 billion, or 91%, of residential
loans (predominantly first and second lien residential mortgages
and home equity lines of credit), $129 million, or 5%, of
commercial loans (predominantly income-producing
properties), and $126 million, or 4%, of consumer loans.
Total TDRs decreased $275 million from December 31,
2013, partially driven by the sale of $149 million of residential
mortgage TDRs in 2014. Accruing TDRs and nonaccruing TDRs
decreased $157 million, or 6%, and $118 million, or 30%, from
December 31, 2013, respectively.
Generally, interest income on restructured loans that have
met sustained performance criteria and have been returned to
accruing status is recognized according to the terms of the
restructuring. Such recognized interest income was $118 million
during both 2014 and 2013. If all such loans had been accruing
interest according to their original contractual terms, estimated
interest income of $153 million and $157 million during 2014
and 2013, respectively, would have been recognized.