SunTrust 2014 Annual Report Download - page 47
Download and view the complete annual report
Please find page 47 of the 2014 SunTrust annual report below. You can navigate through the pages in the report by either clicking on the pages listed below, or by using the keyword search tool below to find specific information within the annual report.-
 1
1 -
2
-
3
-
4
-
5
-
6
-
7
-
8
-
9
-
10
-
11
-
12
-
13
-
14
-
15
-
16
-
17
-
18
-
19
-
20
-
21
-
22
-
23
-
24
-
25
-
26
-
27
-
28
-
29
-
30
-
31
-
32
-
33
-
34
-
35
-
36
-
 37
37 -
 38
38 -
 39
39 -
 40
40 -
 41
41 -
 42
42 -
 43
43 -
 44
44 -
 45
45 -
 46
46 -
 47
47 -
 48
48 -
 49
49 -
 50
50 -
 51
51 -
 52
52 -
 53
53 -
 54
54 -
 55
55 -
 56
56 -
 57
57 -
58
-
59
-
60
-
61
-
62
-
63
-
64
-
65
-
66
-
67
-
68
-
69
-
70
-
71
-
72
-
73
-
74
-
75
-
76
-
77
-
78
-
79
-
80
-
81
-
82
-
83
-
84
-
85
-
86
-
87
-
88
-
89
-
90
-
91
-
92
-
93
-
94
-
95
-
96
-
97
-
98
-
99
-
100
-
101
-
102
-
103
-
104
-
105
-
106
-
107
-
108
-
109
-
110
-
111
-
112
-
113
-
114
-
115
-
116
-
117
-
118
-
119
-
120
-
121
-
122
-
123
-
124
-
125
-
126
-
127
-
128
-
129
-
130
-
131
-
132
-
133
-
134
-
135
-
136
-
137
-
138
-
139
-
140
-
141
-
142
-
143
-
144
-
145
-
146
-
147
-
148
-
149
-
150
-
151
-
152
-
153
-
154
-
155
-
156
-
157
-
158
-
159
-
160
-
161
-
162
-
163
-
164
-
165
-
166
-
167
-
168
-
169
-
170
-
171
-
172
-
173
-
174
-
175
-
176
-
177
-
178
-
179
-
180
-
181
-
182
-
183
-
184
-
185
-
186
-
187
-
188
-
189
-
190
-
191
-
192
-
193
-
194
-
195
-
196
-
197
-
198
-
199
 |
 |

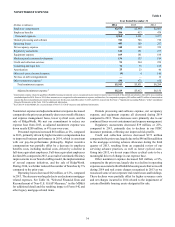
24
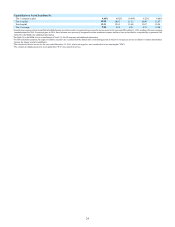
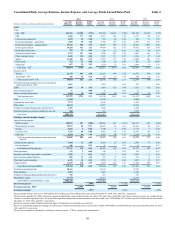
Capital Ratios at Period End (Basel I):
Tier 1 common equity 9.60% 9.82% 10.04% 9.22% 8.08%
Tier 1 capital 10.80 10.81 11.13 10.90 13.67
Total capital 12.51 12.81 13.48 13.67 16.54
Tier 1 leverage 9.64 9.58 8.91 8.75 10.94
1 Amortization expense related to qualified affordable housing investment costs is recognized in provision for income taxes for the year ended December 31, 2014, as allowed by an accounting
standard adopted in 2014. For periods prior to 2014, these amounts were previously recognized in other noninterest expense and have been reclassified for comparability as presented. See
Table 34 in the MD&A for additional information.
2 See Table 34 in the MD&A for a reconcilement of Non-U.S. GAAP measures and additional information.
3 For EPS calculation purposes, the impact of dilutive securities are excluded from the diluted share count during periods in which we recognize a net loss available to common shareholders
because the impact would be antidilutive.
4 The calculated effective tax rate for the year ended December 31, 2010, which was negative, was considered to be not meaningful ("NM").
5 The common dividend payout ratio is not applicable ("N/A") in a period of net loss.