SunTrust 2014 Annual Report Download - page 147
Download and view the complete annual report
Please find page 147 of the 2014 SunTrust annual report below. You can navigate through the pages in the report by either clicking on the pages listed below, or by using the keyword search tool below to find specific information within the annual report.-
 1
1 -
2
-
3
-
4
-
5
-
6
-
7
-
8
-
9
-
10
-
11
-
12
-
13
-
14
-
15
-
16
-
17
-
18
-
19
-
20
-
21
-
22
-
23
-
24
-
25
-
26
-
27
-
28
-
29
-
30
-
31
-
32
-
33
-
34
-
35
-
36
-
37
-
38
-
39
-
40
-
41
-
42
-
43
-
44
-
45
-
46
-
47
-
48
-
49
-
50
-
51
-
52
-
53
-
54
-
55
-
56
-
57
-
58
-
59
-
60
-
61
-
62
-
63
-
64
-
65
-
66
-
67
-
68
-
69
-
70
-
71
-
72
-
73
-
74
-
75
-
76
-
77
-
78
-
79
-
80
-
81
-
82
-
83
-
84
-
85
-
86
-
87
-
88
-
89
-
90
-
91
-
92
-
93
-
94
-
95
-
96
-
97
-
98
-
99
-
100
-
101
-
102
-
103
-
104
-
105
-
106
-
107
-
108
-
109
-
110
-
111
-
112
-
113
-
114
-
115
-
116
-
117
-
118
-
119
-
120
-
121
-
122
-
123
-
124
-
125
-
126
-
127
-
128
-
129
-
130
-
131
-
132
-
133
-
134
-
135
-
136
-
 137
137 -
 138
138 -
 139
139 -
 140
140 -
 141
141 -
 142
142 -
 143
143 -
 144
144 -
 145
145 -
 146
146 -
 147
147 -
 148
148 -
 149
149 -
 150
150 -
 151
151 -
 152
152 -
 153
153 -
 154
154 -
 155
155 -
 156
156 -
 157
157 -
158
-
159
-
160
-
161
-
162
-
163
-
164
-
165
-
166
-
167
-
168
-
169
-
170
-
171
-
172
-
173
-
174
-
175
-
176
-
177
-
178
-
179
-
180
-
181
-
182
-
183
-
184
-
185
-
186
-
187
-
188
-
189
-
190
-
191
-
192
-
193
-
194
-
195
-
196
-
197
-
198
-
199
 |
 |

Notes to Consolidated Financial Statements, continued
124
decisions regarding short-term concerns and any single
investment. Asset allocation, as a percent of the total market
value of the total portfolio, is set with the target percentages and
ranges presented in the investment policy statement.
Rebalancing occurs on a periodic basis to maintain the target
allocation, but normal market activity may result in deviations.
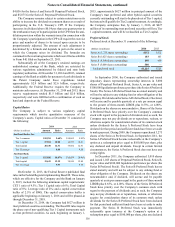
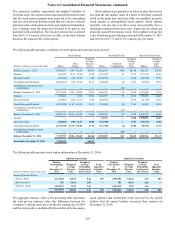
The basis for determining the overall expected long-term
rate of return on plan assets considers past experience, current
market conditions, and expectations on future trends. A building
block approach is used that considers long-term inflation, real
returns, equity risk premiums, target asset allocations, market
corrections, and expenses. Capital market simulations from
internal and external sources, survey data, economic forecasts,
and actuarial judgment are all used in this process. The expected
2014 long-term gross rate of return on plan assets for the
SunTrust Retirement Plan and NCF Retirement Plan was 7.20%
and 6.65%, respectively, gross of administration fees. For 2013,
the expected long-term rate of return on both plans was 7.00%.
The expected long-term gross rate of return is 6.95% for the
SunTrust Retirement Plan and 6.15% for the NCF Retirement
Plan for 2015.
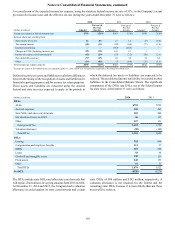
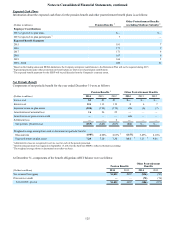
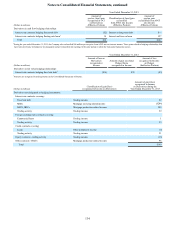
The target allocation and weighted average allocation for
pension plan assets, by asset category, are as follows:
Target
Allocation December 31
2015 2014 2013
Cash equivalents 0-10 % 4% 3%
Equity securities 0-50 48 48
Debt securities 50-100 48 49
Total 100% 100%
The investment strategy for the other postretirement benefit
plans is maintained separately from the strategy for the pension
plans. The Company’s investment strategy is to create a series
of investment returns sufficient to provide a commensurate
amount of long-term growth of capital (both principal and
income) in order to satisfy the other postretirement benefit plan's
obligations. These assets are diversified among equity funds and
fixed income investments according to the asset mix approved
by the SBFC, which is presented in the target allocation table
below. With the other postretirement benefits having a shorter
time horizon, a lower equity profile is appropriate. The pre-tax
expected long-term rate of return on retiree life insurance plan
assets was 5.25% for 2014 and 5.00% for 2013. The 2015 pre-
tax expected long-term rate of return on retiree life plan assets
is 5.00%. The after-tax expected long-term rate of return on
retiree health plan assets was 3.41% for 2014 and 3.25% for
2013. The 2015 after-tax expected long-term rate of return on
retiree health plan assets is 3.25%. During 2014 and 2013, there
was no SunTrust common stock held in the other postretirement
benefit plans.
The target allocation and weighted average allocation for
other postretirement benefit plan assets, by asset category, are
as follows:
Target
Allocation December 31
2015 2014 2013
Cash equivalents 5-15 % 8% 5%
Equity securities 20-40 32 33
Debt securities 50-70 60 62
Total 100% 100%
The Company sets pension asset values equal to their market
value, in contrast to the use of a smoothed asset value that
incorporates gains and losses over a period of years. Utilization
of market value of assets provides a more realistic economic
measure of the plan’s funded status and cost. Assumed discount
rates and expected returns on plan assets affect the amounts of
net periodic benefit. A 25 basis point increase/decrease in the
expected long-term return on plan assets would increase/
decrease the net periodic benefit by $7 million for all pension
and other postretirement plans. A 25 basis point increase/
decrease in the discount rate would change the net periodic
benefit by less than $1 million for all pension and other
postretirement plans.
Assumed healthcare cost trend rates have a significant effect
on the amounts reported for the other postretirement benefit
plans. At December 31, 2014, the Company assumed that pre-65
retiree health care costs will increase at an initial rate of
7.50% per year. The Company expects this annual cost increase
to decrease over a 10-year period to 5.00% per year. A 1%
increase or decrease on other postretirement benefit obligations,
service cost, and interest cost are less than $1 million,
respectively.