SunTrust 2014 Annual Report Download - page 72
Download and view the complete annual report
Please find page 72 of the 2014 SunTrust annual report below. You can navigate through the pages in the report by either clicking on the pages listed below, or by using the keyword search tool below to find specific information within the annual report.-
 1
1 -
2
-
3
-
4
-
5
-
6
-
7
-
8
-
9
-
10
-
11
-
12
-
13
-
14
-
15
-
16
-
17
-
18
-
19
-
20
-
21
-
22
-
23
-
24
-
25
-
26
-
27
-
28
-
29
-
30
-
31
-
32
-
33
-
34
-
35
-
36
-
37
-
38
-
39
-
40
-
41
-
42
-
43
-
44
-
45
-
46
-
47
-
48
-
49
-
50
-
51
-
52
-
53
-
54
-
55
-
56
-
57
-
58
-
59
-
60
-
61
-
 62
62 -
 63
63 -
 64
64 -
 65
65 -
 66
66 -
 67
67 -
 68
68 -
 69
69 -
 70
70 -
 71
71 -
 72
72 -
 73
73 -
 74
74 -
 75
75 -
 76
76 -
 77
77 -
 78
78 -
 79
79 -
 80
80 -
 81
81 -
 82
82 -
83
-
84
-
85
-
86
-
87
-
88
-
89
-
90
-
91
-
92
-
93
-
94
-
95
-
96
-
97
-
98
-
99
-
100
-
101
-
102
-
103
-
104
-
105
-
106
-
107
-
108
-
109
-
110
-
111
-
112
-
113
-
114
-
115
-
116
-
117
-
118
-
119
-
120
-
121
-
122
-
123
-
124
-
125
-
126
-
127
-
128
-
129
-
130
-
131
-
132
-
133
-
134
-
135
-
136
-
137
-
138
-
139
-
140
-
141
-
142
-
143
-
144
-
145
-
146
-
147
-
148
-
149
-
150
-
151
-
152
-
153
-
154
-
155
-
156
-
157
-
158
-
159
-
160
-
161
-
162
-
163
-
164
-
165
-
166
-
167
-
168
-
169
-
170
-
171
-
172
-
173
-
174
-
175
-
176
-
177
-
178
-
179
-
180
-
181
-
182
-
183
-
184
-
185
-
186
-
187
-
188
-
189
-
190
-
191
-
192
-
193
-
194
-
195
-
196
-
197
-
198
-
199
 |
 |
49
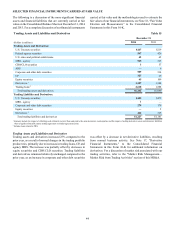
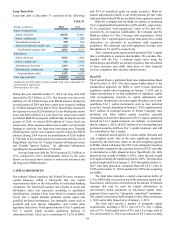
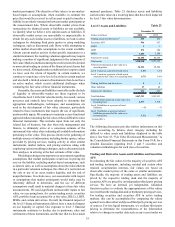
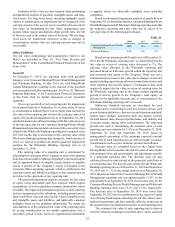
Long-Term Debt
Long-term debt at December 31 consisted of the following:
Table 21
(Dollars in millions) 2014 2013
Parent Company Only:
Senior, fixed rate $3,630 $3,001
Senior, variable rate 358 283
Subordinated, fixed rate 200 200
Junior subordinated, variable rate 627 627
Total Parent Company debt 4,815 4,111
Subsidiaries:
Senior, fixed rate 5,682 1,006
Senior, variable rate 1742 3,783
Subordinated, fixed rate 21,283 1,300
Subordinated, variable rate 500 500
Total subsidiaries debt 8,207 6,589
Total long-term debt $13,022 $10,700
1 Includes $0 and $256 million of debt recorded at fair value at December 31,
2014 and 2013, respectively.
2 Debt recorded at fair value.
During the year ended December 31, 2014, our long-term debt
increased by $2.3 billion, or 22%. The increase was due to the
addition of a $1.0 billion long-term FHLB advance during the
second quarter of 2014 and three senior note issuances totaling
$1.5 billion during the first half of 2014. Specifically, during the
first quarter we issued $250 million of 3-year floating rate senior
notes and $600 million of 3-year fixed rate senior notes under
our Global Bank Note program. Additionally, during the second
quarter of 2014, we issued $650 million of 5-year fixed rate
senior notes. These issuances allowed us to add to our wholesale
funding at relatively low long-term borrowing rates. Partially
offsetting these senior note issuances and the long-term FHLB
advance during 2014 was the deconsolidation of $256 million
of VIE debt in the second quarter in connection with the sale of
RidgeWorth. See Note 10, “Certain Transfers of Financial Assets
and Variable Interest Entities,” for additional information
regarding the deconsolidation of VIE debt.
Average long-term debt for 2014 increased $2.5 billion, or
25%, compared to 2013, predominantly driven by the same
factors as discussed above related to senior note issuances and
the long-term FHLB advance.
CAPITAL RESOURCES
Our primary federal regulator, the Federal Reserve, measures
capital adequacy within a framework that sets capital
requirements relative to the risk profiles of individual banking
companies. The framework assigns risk weights to assets and
off-balance sheet risk exposures according to predefined
classifications, creating a base from which to compare capital
levels. Tier 1 capital includes primarily certain equity and
qualified preferred instruments, less intangible assets such as
goodwill and core deposit intangibles, and certain other
regulatory deductions. Total capital consists of Tier 1 capital and
Tier 2 capital, which includes qualifying portions of
subordinated debt, ALLL up to a maximum of 1.25% of RWA,
and 45% of unrealized gains on equity securities. Mark-to-
market adjustments related to our credit spreads for fair value
debt and index-linked CDs are excluded from regulatory capital.
Both the Company and the Bank are subject to minimum
Tier 1 capital and Total capital ratios of 4% and 8%, respectively.
To be considered “well-capitalized,” ratios of 6% and 10%,
respectively, are required. Additionally, the Company and the
Bank are subject to a Tier 1 leverage ratio requirement, which
measures Tier 1 capital against average total assets less certain
deductions, as calculated in accordance with regulatory
guidelines. The minimum and well-capitalized leverage ratio
thresholds are 3% and 5%, respectively.
Tier 1 common equity represents the portion of Tier 1 capital
that is attributable to common shareholders. We calculate this,
together with the Tier 1 common equity ratio, using the
methodology specified by our primary regulator. Our calculation
of these measures may differ from those of other financial
services companies that calculate similar metrics.
Basel III
The Federal Reserve published final rules implementing Basel
III on October 11, 2013. The rules require banks subject to the
standardized approach for RWA to meet revised minimum
regulatory capital ratios beginning on January 1, 2015, and to
begin transitioning to revised definitions of regulatory capital
with accompanying revisions to capital adjustments and
deductions. In particular, the rules require the phase out of non-
qualifying Tier 1 capital instruments such as trust preferred
securities. As such, beginning on January 1, 2015, approximately
$627 million in principal amount of Parent Company trust
preferred and other hybrid capital securities currently
outstanding will start to be phased out of Tier 1 capital, qualifying
instead for Tier 2 capital treatment. Accordingly, we anticipate
that by January 1, 2016, all $627 million of our outstanding trust
preferred securities will lose Tier 1 capital treatment, and will
be reclassified as Tier 2 capital.
A transition period applies to certain capital elements and
risk weighted assets. One of the more significant transitions
required by the final rules relates to the risk weighting applied
to MSRs, which will impact the CET1 ratio during the transition
period when compared to the currently disclosed CET1 ratio that
is calculated on a fully phased-in basis. Specifically, the fully
phased-in risk weight of MSRs is 250%, while the risk weight
to be applied during the transition period is 100%. The transition
period is applicable from January 1, 2015 through December 31,
2017. Our fully phased-in, estimated Basel III CET 1 ratio of
9.69% at December 31, 2014 considers the 250% risk-weighting
for MSRs.
The final rules introduce a capital conservation buffer of
2.5% of RWA that is layered on top of the minimum capital risk-
based ratios, which places restrictions on the amount of retained
earnings that may be used for capital distributions or
discretionary bonus payments as risk-based capital ratios
approach their respective “adequately capitalized” minimums.
The capital conservation buffer begins to take effect on January
1, 2016 and is fully phased-in as of January 1, 2019.
The final rules specify a number of minimum capital
requirements, including a CET 1 ratio of 4.5%; Tier 1 capital
ratio of 6%; Total capital ratio of 8%; and a Leverage ratio of
4%. At December 31, 2014, our estimated CET 1 ratio on a fully