SunTrust 2014 Annual Report Download - page 172
Download and view the complete annual report
Please find page 172 of the 2014 SunTrust annual report below. You can navigate through the pages in the report by either clicking on the pages listed below, or by using the keyword search tool below to find specific information within the annual report.-
 1
1 -
2
-
3
-
4
-
5
-
6
-
7
-
8
-
9
-
10
-
11
-
12
-
13
-
14
-
15
-
16
-
17
-
18
-
19
-
20
-
21
-
22
-
23
-
24
-
25
-
26
-
27
-
28
-
29
-
30
-
31
-
32
-
33
-
34
-
35
-
36
-
37
-
38
-
39
-
40
-
41
-
42
-
43
-
44
-
45
-
46
-
47
-
48
-
49
-
50
-
51
-
52
-
53
-
54
-
55
-
56
-
57
-
58
-
59
-
60
-
61
-
62
-
63
-
64
-
65
-
66
-
67
-
68
-
69
-
70
-
71
-
72
-
73
-
74
-
75
-
76
-
77
-
78
-
79
-
80
-
81
-
82
-
83
-
84
-
85
-
86
-
87
-
88
-
89
-
90
-
91
-
92
-
93
-
94
-
95
-
96
-
97
-
98
-
99
-
100
-
101
-
102
-
103
-
104
-
105
-
106
-
107
-
108
-
109
-
110
-
111
-
112
-
113
-
114
-
115
-
116
-
117
-
118
-
119
-
120
-
121
-
122
-
123
-
124
-
125
-
126
-
127
-
128
-
129
-
130
-
131
-
132
-
133
-
134
-
135
-
136
-
137
-
138
-
139
-
140
-
141
-
142
-
143
-
144
-
145
-
146
-
147
-
148
-
149
-
150
-
151
-
152
-
153
-
154
-
155
-
156
-
157
-
158
-
159
-
160
-
161
-
 162
162 -
 163
163 -
 164
164 -
 165
165 -
 166
166 -
 167
167 -
 168
168 -
 169
169 -
 170
170 -
 171
171 -
 172
172 -
 173
173 -
 174
174 -
 175
175 -
 176
176 -
 177
177 -
 178
178 -
 179
179 -
 180
180 -
 181
181 -
 182
182 -
183
-
184
-
185
-
186
-
187
-
188
-
189
-
190
-
191
-
192
-
193
-
194
-
195
-
196
-
197
-
198
-
199
 |
 |
Notes to Consolidated Financial Statements, continued
149
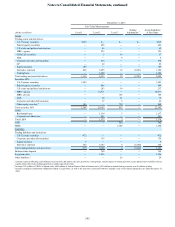
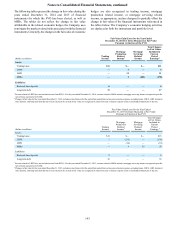
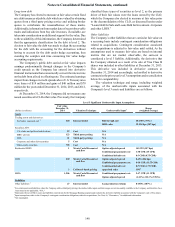
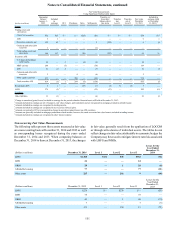
Level 3 Significant Unobservable Input Assumptions
(Dollars in millions)
Fair value
December 31,
2013 Valuation Technique Unobservable Input 1Range
(weighted average)
Assets
Trading assets and derivatives:
CDO/CLO securities $54 Matrix pricing/Discounted
cash flow Indicative pricing based on
overcollateralization ratio $50-$60 ($54)
Discount margin 4-6% (5%)
ABS 6 Matrix pricing Indicative pricing $55 ($55)
Derivative contracts, net 2, 3 5 Internal model Pull through rate 1-99% (74%)
MSR value 42-222 bps (111 bps)
Securities AFS:
U.S. states and political subdivisions 34 Matrix pricing Indicative pricing $80-$111 ($95)
MBS - private 154 Third party pricing N/A
ABS 21 Third party pricing N/A
Corporate and other debt securities 5 Cost N/A
Other equity securities 739 Cost N/A
Residential LHFS 3 Monte Carlo/Discounted
cash flow Option adjusted spread 250-675 bps (277 bps)
Conditional prepayment rate 2-10 CPR (7 CPR)
Conditional default rate 0-4 CDR (0.5 CDR)
LHFI 292 Monte Carlo/Discounted
cash flow Option adjusted spread 0-675 bps (307 bps)
Conditional prepayment rate 1-30 CPR (13 CPR)
Conditional default rate 0-7 CDR (2.5 CDR)
10 Collateral based pricing Appraised value NM 4
MSRs 1,300 Discounted cash flow Conditional prepayment rate 4-25 CPR (8 CPR)
Discount rate 9-28% (12%)
Liabilities
Other liabilities 423 Internal model Loan production volume 0-150% (92%)
3 Internal model Revenue run rate NM 5
1 For certain assets and liabilities where the Company utilizes third party pricing, the unobservable inputs and their ranges are not reasonably available to the Company, and therefore, have
been noted as not applicable, "N/A."
2 Represents the net of IRLC assets and liabilities entered into by the Mortgage Banking segment.
3 Includes a $3 million derivative liability associated with the Company's sale of Visa shares during the year ended December 31, 2009.
4 Input assumptions relate to the Company's contingent consideration obligations related to acquisitions. Excludes $3 million of Other Liabilities. See Note 16, "Guarantees," for additional
information.
5 Not meaningful.