SunTrust 2014 Annual Report Download - page 107
Download and view the complete annual report
Please find page 107 of the 2014 SunTrust annual report below. You can navigate through the pages in the report by either clicking on the pages listed below, or by using the keyword search tool below to find specific information within the annual report.
84
SunTrust Banks, Inc.
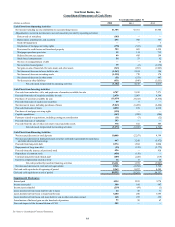
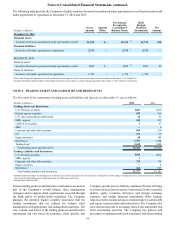
Consolidated Statements of Cash Flows
Year Ended December 31
(Dollars in millions) 2014 2013 2012
Cash Flows from Operating Activities
Net income including income attributable to noncontrolling interest $1,785 $1,361 $1,984
Adjustments to reconcile net income to net cash (used in) provided by operating activities:
Gain on sale of subsidiary (105) — —
Depreciation, amortization, and accretion 693 708 757
Goodwill impairment —— 7
Origination of mortgage servicing rights (178) (352) (336)
Provisions for credit losses and foreclosed property 364 605 1,535
Mortgage repurchase provision 12 114 713
Deferred income tax expense 99 495 194
Stock-based compensation 54 53 62
Net loss on extinguishment of debt —— 16
Net securities losses/(gains) 15 (2) (1,974)
Net gain on sale of loans held for sale, loans, and other assets (343) (267) (1,063)
Net (increase)/decrease in loans held for sale (1,567) 2,104 194
Net (increase)/decrease in trading assets (1,529) 770 170
Net (increase)/decrease in other assets (51) (533) 807
Net decrease in other liabilities (431) (846) (1,053)
Net cash (used in)/provided by operating activities (1,182) 4,210 2,013
Cash Flows from Investing Activities
Proceeds from maturities, calls, and paydowns of securities available for sale 4,707 5,522 7,371
Proceeds from sales of securities available for sale 2,470 2,063 4,300
Purchases of securities available for sale (11,039) (9,215) (5,814)
Proceeds from sales of auction rate securities 59 8 —
Net increase in loans, including purchases of loans (9,843) (8,409) (6,400)
Proceeds from sales of loans 4,090 819 4,916
Purchases of mortgage servicing rights (130) — —
Capital expenditures (147) (200) (206)
Payments related to acquisitions, including contingent consideration (11) (3) (12)
Proceeds from sale of subsidiary 193 — —
Proceeds from the sale of other real estate owned and other assets 378 472 585
Net cash (used in)/provided by investing activities (9,273) (8,943) 4,740
Cash Flows from Financing Activities
Net increase/(decrease) in total deposits 10,808 (2,557) 4,394
Net increase/(decrease) in funds purchased, securities sold under agreements to repurchase,
and other short-term borrowings 447 3,245 (5,972)
Proceeds from long-term debt 2,574 1,564 4,000
Repayments of long-term debt (53) (155) (5,772)
Proceeds from the issuance of preferred stock 496 — 438
Repurchase of common stock (458) (150) —
Common and preferred dividends paid (409) (225) (119)
Incentive compensation related activity 16 17 26
Net cash provided by/(used in) financing activities 13,421 1,739 (3,005)
Net increase/(decrease) in cash and cash equivalents 2,966 (2,994) 3,748
Cash and cash equivalents at beginning of period 5,263 8,257 4,509
Cash and cash equivalents at end of period $8,229 $5,263 $8,257
Supplemental Disclosures:
Interest paid $534 $533 $774
Income taxes paid 380 168 607
Income taxes refunded (219) (99) (1)
Loans transferred from loans held for sale to loans 44 43 71
Loans transferred from loans to loans held for sale 3,280 280 3,695
Loans transferred from loans and loans held for sale to other real estate owned 148 255 399
Amortization of deferred gain on sale leaseback of premises 53 58 67
Non-cash impact of the deconsolidation of CLO 282 — —
See Notes to Consolidated Financial Statements.


