SunTrust 2014 Annual Report Download - page 77
Download and view the complete annual report
Please find page 77 of the 2014 SunTrust annual report below. You can navigate through the pages in the report by either clicking on the pages listed below, or by using the keyword search tool below to find specific information within the annual report.-
 1
1 -
2
-
3
-
4
-
5
-
6
-
7
-
8
-
9
-
10
-
11
-
12
-
13
-
14
-
15
-
16
-
17
-
18
-
19
-
20
-
21
-
22
-
23
-
24
-
25
-
26
-
27
-
28
-
29
-
30
-
31
-
32
-
33
-
34
-
35
-
36
-
37
-
38
-
39
-
40
-
41
-
42
-
43
-
44
-
45
-
46
-
47
-
48
-
49
-
50
-
51
-
52
-
53
-
54
-
55
-
56
-
57
-
58
-
59
-
60
-
61
-
62
-
63
-
64
-
65
-
66
-
 67
67 -
 68
68 -
 69
69 -
 70
70 -
 71
71 -
 72
72 -
 73
73 -
 74
74 -
 75
75 -
 76
76 -
 77
77 -
 78
78 -
 79
79 -
 80
80 -
 81
81 -
 82
82 -
 83
83 -
 84
84 -
 85
85 -
 86
86 -
 87
87 -
88
-
89
-
90
-
91
-
92
-
93
-
94
-
95
-
96
-
97
-
98
-
99
-
100
-
101
-
102
-
103
-
104
-
105
-
106
-
107
-
108
-
109
-
110
-
111
-
112
-
113
-
114
-
115
-
116
-
117
-
118
-
119
-
120
-
121
-
122
-
123
-
124
-
125
-
126
-
127
-
128
-
129
-
130
-
131
-
132
-
133
-
134
-
135
-
136
-
137
-
138
-
139
-
140
-
141
-
142
-
143
-
144
-
145
-
146
-
147
-
148
-
149
-
150
-
151
-
152
-
153
-
154
-
155
-
156
-
157
-
158
-
159
-
160
-
161
-
162
-
163
-
164
-
165
-
166
-
167
-
168
-
169
-
170
-
171
-
172
-
173
-
174
-
175
-
176
-
177
-
178
-
179
-
180
-
181
-
182
-
183
-
184
-
185
-
186
-
187
-
188
-
189
-
190
-
191
-
192
-
193
-
194
-
195
-
196
-
197
-
198
-
199
 |
 |
54
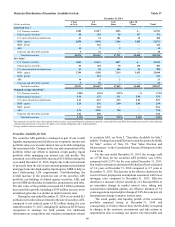
executed, market information received from outside market
participants and analysts, and/or changes in the underlying
collateral performance.
We also gather third party broker quotes or use industry-
standard or proprietary models to estimate the fair value of these
instruments particularly when pricing service information or
observable market trades are not available. In most cases, the
current market conditions cause the broker quotes to be
indicative and the price indications and broker quotes to be
supported by very limited to no recent market activity. In those
instances, we weighted the third party information according to
our judgment of it being a reasonable indication of the
instrument's fair value.
When fair values are estimated based on models, we
consider relevant market indices that correlate to the underlying
collateral, along with assumptions such as liquidity discounts,
interest rates, prepayment speeds, default rates, loss severity
rates, and discount rates. In markets with higher liquidity, we
have more pricing information from third parties and a reduction
in the need to use internal pricing models to estimate fair value.
Even when third party pricing is available, we continued to
classify certain assets as level 3 as we believe that this third party
pricing relied on significant unobservable assumptions, as
evidenced by a persistently wide bid-ask price range and
variability in pricing from the pricing services, particularly for
the vintages and exposures we hold.
As certain markets recover, we are able to reduce our
exposure to many of our level 3 instruments through sales,
maturities, or other distributions at prices approximating our
previous estimates, thereby corroborating the valuation
approaches used.
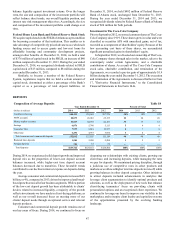
All of the techniques used and information obtained in the
valuation process provide a range of estimated values, which
were evaluated and compared in order to establish an estimated
value that, based on management's judgment, represented a
reasonable estimate of the instrument's fair value. It was not
uncommon for the range of value of these instruments to vary
widely; in such cases, we selected an estimated value that we
believed was the best indication of value based on the yield a
market participant in this current environment would expect. Due
to the continued illiquidity and credit risk of level 3 securities,
these market values are highly sensitive to assumption changes
and market volatility. Improvements may be made to our pricing
methodologies on an ongoing basis as observable and relevant
information becomes available to us.
Most derivative instruments are level 1 or level 2
instruments, except for the IRLCs and the Visa litigation related
derivative, which are level 3 instruments. See Note 17,
“Derivative Financial Instruments,” to the Consolidated
Financial Statements in this Form 10-K for a detailed discussion
regarding derivative contracts and valuation.
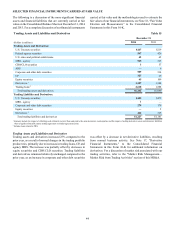
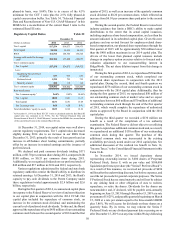
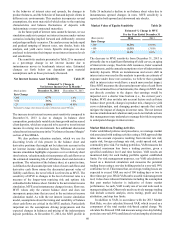
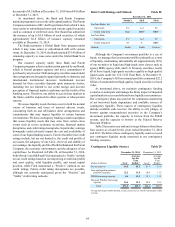
At December 31, 2014, level 3 trading assets and derivatives
and level 3 securities AFS totaled $25 million and $946 million,
respectively. Our level 3 securities AFS portfolio included FHLB
and Federal Reserve Bank stock, as well as certain municipal
bond securities, some of which are only redeemable with the
issuer at par and cannot be traded in the market; as such, no
significant observable market data for these instruments is
available. These nonmarketable securities AFS totaled
approximately $797 million at December 31, 2014. The
remaining level 3 securities, both trading assets and securities
AFS, are predominantly private ABS and MBS, including
interests retained from Company-sponsored securitizations or
purchased from third party securitizations. For all level 3
securities, little or no market activity exists for either the security
or the underlying collateral and therefore, the significant
assumptions used to value the securities are not market
observable.
Level 3 trading assets and derivatives decreased by $47
million, or 65%, during the year ended December 31, 2014,
primarily due to sales of securities. Level 3 securities AFS
decreased by $7 million, or 1%, during the year ended
December 31, 2014 due to continued paydowns and sales
partially offset by purchases. During the year ended
December 31, 2014, we recognized $264 million in net gains
through earnings related to trading and derivative assets and
liabilities classified as level 3, primarily due to $252 million in
IRLC related gains and $12 million in net gains from trading
securities.
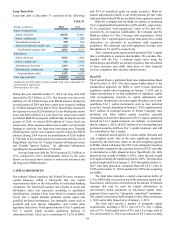
Loans
The fair values of LHFI and LHFS are based on observable
current market prices in the secondary loan market in which loans
trade, as either whole loans or as ABS. When security prices are
obtained in the secondary loan market, we will translate these
prices into whole loan prices by incorporating adjustments for
estimated credit enhancement costs, loan servicing fees, and
various other transformation costs, when material. The fair value
of a loan is impacted by the nature of the asset and the market
liquidity. Level 3 loans are predominantly mortgage loans that
have been deemed not marketable, largely due to borrower
defaults or the identification of other loan defects. When
estimating fair value for these loans, we use a discounted cash
flow approach based on assumptions that are generally not
observable in the current markets, such as prepayment speeds,
default rates, loss severity rates, and liquidity discounts. Absent
comparable current market data, we believe that the fair value
derived from these various approaches is a reasonable
approximation of the prices that we would receive upon sale of
the loans.
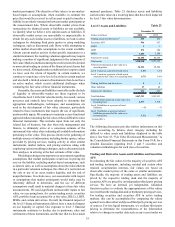
Other Intangible Assets and Other Assets
We record all MSRs at fair value on a recurring basis. The fair
value of MSRs is based on discounted cash flow analyses and
can be highly variable quarter to quarter as market conditions
and projected interest rates change. We provide disclosure of the
key economic assumptions used to measure MSRs and residual
interests and a sensitivity analysis to adverse changes to these
assumptions in Note 9, “Goodwill and Other Intangible Assets,”
to the Consolidated Financial Statements in this Form 10-K. This
sensitivity analysis does not take into account hedging activities
discussed in the “Other Market Risk” section of this MD&A.
The fair values of OREO and other repossessed assets are
measured on a non-recurring basis and are typically determined
based on recent appraisals by third parties and other market
information. Our OREO properties are concentrated in Georgia,
Florida, and North Carolina. Further deterioration in property
values in those states or changes to our disposition strategies
could cause our estimates of OREO values to decline which
would result in further write-downs.