SunTrust 2014 Annual Report Download - page 6
Download and view the complete annual report
Please find page 6 of the 2014 SunTrust annual report below. You can navigate through the pages in the report by either clicking on the pages listed below, or by using the keyword search tool below to find specific information within the annual report.-
 1
1 -
 2
2 -
 3
3 -
 4
4 -
 5
5 -
 6
6 -
 7
7 -
 8
8 -
 9
9 -
 10
10 -
 11
11 -
 12
12 -
 13
13 -
 14
14 -
 15
15 -
 16
16 -
 17
17 -
18
-
19
-
20
-
21
-
22
-
23
-
24
-
25
-
26
-
27
-
28
-
29
-
30
-
31
-
32
-
33
-
34
-
35
-
36
-
37
-
38
-
39
-
40
-
41
-
42
-
43
-
44
-
45
-
46
-
47
-
48
-
49
-
50
-
51
-
52
-
53
-
54
-
55
-
56
-
57
-
58
-
59
-
60
-
61
-
62
-
63
-
64
-
65
-
66
-
67
-
68
-
69
-
70
-
71
-
72
-
73
-
74
-
75
-
76
-
77
-
78
-
79
-
80
-
81
-
82
-
83
-
84
-
85
-
86
-
87
-
88
-
89
-
90
-
91
-
92
-
93
-
94
-
95
-
96
-
97
-
98
-
99
-
100
-
101
-
102
-
103
-
104
-
105
-
106
-
107
-
108
-
109
-
110
-
111
-
112
-
113
-
114
-
115
-
116
-
117
-
118
-
119
-
120
-
121
-
122
-
123
-
124
-
125
-
126
-
127
-
128
-
129
-
130
-
131
-
132
-
133
-
134
-
135
-
136
-
137
-
138
-
139
-
140
-
141
-
142
-
143
-
144
-
145
-
146
-
147
-
148
-
149
-
150
-
151
-
152
-
153
-
154
-
155
-
156
-
157
-
158
-
159
-
160
-
161
-
162
-
163
-
164
-
165
-
166
-
167
-
168
-
169
-
170
-
171
-
172
-
173
-
174
-
175
-
176
-
177
-
178
-
179
-
180
-
181
-
182
-
183
-
184
-
185
-
186
-
187
-
188
-
189
-
190
-
191
-
192
-
193
-
194
-
195
-
196
-
197
-
198
-
199
 |
 |

4
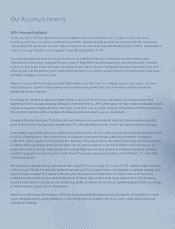
Our Accomplishments
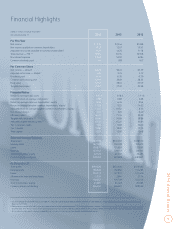
2014 Financial Highlights
For the year 2014, SunTrust reported net income available to common shareholders of $1.7 billion, or $3.23 per share.
Excluding certain non-core items in both 2013 and 2014, adjusted earnings per share were $2.74 and $3.24, respectively,
representing 18% growth year over year. Adjusted return on average assets improved 10 basis points to 0.98%, while adjusted
return on average tangible common equity increased 85 basis points to 11.4%.
Our earnings growth and improved returns were driven by a significant reduction in expenses and further asset quality
improvement. Total revenue, excluding the gain on sale of RidgeWorth Capital Management, was relatively stable compared
to the prior year, as the impact of a lower net interest margin and the decline in mortgage origination activity was more than
offset by solid loan and deposit growth, additional momentum in our wealth management and investment banking businesses,
and higher mortgage servicing income.
Adjusted expenses declined by approximately $200 million, as we right-sized our mortgage business and cyclical costs were
reduced. However, a portion of these savings was reinvested in key growth areas, which we believe will drive sustainable
profitability over the long term.
Accordingly, we achieved an adjusted tangible efficiency ratio of 63% for the year, well ahead of the target we set at the
beginning of 2014 and approximately 200 basis points better than our 2013 performance. We have made considerable progress
toward our long-term tangible efficiency ratio target of sub-60%, and we remain firmly focused on that commitment. Achieving
this important objective will be a key driver of delivering additional value to you, our shareholders.
Average performing loans grew 7%, led by continued momentum in commercial and industrial, commercial real estate and
direct consumer loans. Average client deposits grew 4%, with a favorable mix shift to lower-cost deposit products continuing.
Credit quality continued to improve, as nonperforming loans declined 35% to 0.48% of loans and net charge-offs declined 34%
to 0.34% of average loans. These improvements, in conjunction with sustained high-quality loan production, contributed
to the $211 million reduction in the provision for credit losses. This performance is the result of improving economic conditions,
in addition to the significant actions we have taken over the past several years to de-risk our balance sheet and improve the
quality of our loan production. Acknowledging our substantially improved asset quality and increased profitability, Standard
and Poor’s upgraded the senior long-term credit rating of our primary operating subsidiary, SunTrust Bank, to “A-” from “BBB+”
in the fourth quarter.
We continued to maintain strong capital levels, with a Basel III Common Equity Tier 1 ratio of 9.7%, relatively stable compared
to the prior year. We did this while also growing total assets by 9% to support further client business. In addition, tangible book
value per share increased 10% relative to the prior year. We repurchased $458 million of common stock in 2014, and we
doubled our total annual common stock dividend from $0.35 per share in 2013 to $0.70 per share in 2014. The cumulative
actions we have taken to improve our risk and earnings profile, combined with our strong capital and liquidity levels, should help
us further increase capital return to shareholders.
Aside from a solid financial performance, 2014 also marked a meaningful step forward with regard to the resolution of certain
legacy mortgage matters, which will allow us to more firmly focus on meeting more of our clients’ needs while driving more
consistent profitability.