SunTrust 2014 Annual Report Download - page 59
Download and view the complete annual report
Please find page 59 of the 2014 SunTrust annual report below. You can navigate through the pages in the report by either clicking on the pages listed below, or by using the keyword search tool below to find specific information within the annual report.-
 1
1 -
2
-
3
-
4
-
5
-
6
-
7
-
8
-
9
-
10
-
11
-
12
-
13
-
14
-
15
-
16
-
17
-
18
-
19
-
20
-
21
-
22
-
23
-
24
-
25
-
26
-
27
-
28
-
29
-
30
-
31
-
32
-
33
-
34
-
35
-
36
-
37
-
38
-
39
-
40
-
41
-
42
-
43
-
44
-
45
-
46
-
47
-
48
-
 49
49 -
 50
50 -
 51
51 -
 52
52 -
 53
53 -
 54
54 -
 55
55 -
 56
56 -
 57
57 -
 58
58 -
 59
59 -
 60
60 -
 61
61 -
 62
62 -
 63
63 -
 64
64 -
 65
65 -
 66
66 -
 67
67 -
 68
68 -
 69
69 -
70
-
71
-
72
-
73
-
74
-
75
-
76
-
77
-
78
-
79
-
80
-
81
-
82
-
83
-
84
-
85
-
86
-
87
-
88
-
89
-
90
-
91
-
92
-
93
-
94
-
95
-
96
-
97
-
98
-
99
-
100
-
101
-
102
-
103
-
104
-
105
-
106
-
107
-
108
-
109
-
110
-
111
-
112
-
113
-
114
-
115
-
116
-
117
-
118
-
119
-
120
-
121
-
122
-
123
-
124
-
125
-
126
-
127
-
128
-
129
-
130
-
131
-
132
-
133
-
134
-
135
-
136
-
137
-
138
-
139
-
140
-
141
-
142
-
143
-
144
-
145
-
146
-
147
-
148
-
149
-
150
-
151
-
152
-
153
-
154
-
155
-
156
-
157
-
158
-
159
-
160
-
161
-
162
-
163
-
164
-
165
-
166
-
167
-
168
-
169
-
170
-
171
-
172
-
173
-
174
-
175
-
176
-
177
-
178
-
179
-
180
-
181
-
182
-
183
-
184
-
185
-
186
-
187
-
188
-
189
-
190
-
191
-
192
-
193
-
194
-
195
-
196
-
197
-
198
-
199
 |
 |
36
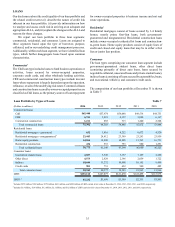
Selected Loan Maturity Data Table 8
(Dollars in millions)
At December 31, 2014
Total 1 year or less 1-5 years After 5 years
Loan Maturity
C&I and CRE 1$66,863 $19,905 $40,953 $6,005
Commercial construction 1,211 191 944 76
Total $68,074 $20,096 $41,897 $6,081
Interest Rate Sensitivity:
Selected loans with:
Predetermined interest rates $4,872 $3,172
Floating or adjustable interest rates 37,025 2,909
Total $41,897 $6,081
1 Excludes $4.6 billion in lease financing and $687 million in installment loans.
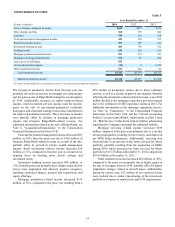
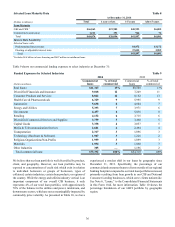
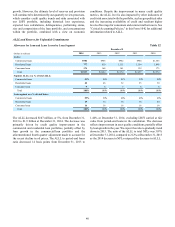
Table 9 shows our commercial lending exposure to select industries at December 31:
Funded Exposures by Selected Industries Table 9
2014 2013
(Dollars in millions) Commercial
loans % of total
commercial Commercial
loans % of total
commercial
Real Estate $11,343 15% $8,500 13%
Diversified Financials and Insurance 9,018 12 7,249 11
Consumer Products and Services 8,822 12 8,152 13
Health Care & Pharmaceuticals 6,329 9 5,995 9
Automotive 5,638 8 4,604 7
Energy and Utilities 5,393 7 3,971 6
Government 4,457 6 5,036 8
Retailing 4,132 6 3,715 6
Diversified Commercial Services and Supplies 3,759 5 3,460 5
Capital Goods 3,338 4 3,057 5
Media & Telecommunication Services 2,681 4 2,494 4
Transportation 2,317 3 1,896 3
Technology (Hardware & Software) 1,967 3 1,226 2
Religious Organizations/Non-Profits 1,959 3 1,899 3
Materials 1,934 3 1,860 3
Other Industries 305 — 1,196 2
Total commercial loans $73,392 100% $64,310 100%
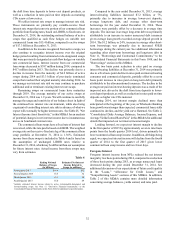
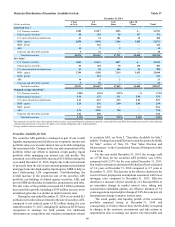
We believe that our loan portfolio is well diversified by product,
client, and geography. However, our loan portfolio may be
exposed to concentrations of credit risk which exist in relation
to individual borrowers or groups of borrowers, types of
collateral, certain industries, certain loan products, or regions of
the country. While the energy and utilities industry vertical is an
important component of our overall CIB business, it only
represents 4% of our total loan portfolio, with approximately
70% of the balance in the utilities and power, midstream, and
downstream sectors, which are not as meaningfully impacted by
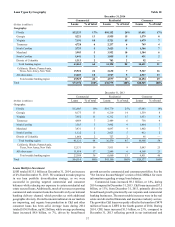
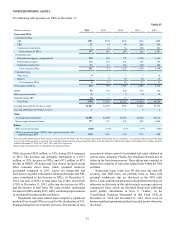
commodity price volatility. As presented in Table 10, we have
experienced a modest shift in our loans by geography since
December 31, 2013. Specifically, the percentage of our
commercial and consumer loans to clients outside of our regional
banking footprint compared to our total loan portfolio increased,
primarily resulting from loan growth in our CIB and National
Consumer Lending businesses, which serve clients nationwide.
See Note 6, “Loans,” to the Consolidated Financial Statements
in this Form 10-K for more information. Table 10 shows the
percentage breakdown of our LHFI portfolio by geographic
region.