SunTrust 2014 Annual Report Download - page 87
Download and view the complete annual report
Please find page 87 of the 2014 SunTrust annual report below. You can navigate through the pages in the report by either clicking on the pages listed below, or by using the keyword search tool below to find specific information within the annual report.-
 1
1 -
2
-
3
-
4
-
5
-
6
-
7
-
8
-
9
-
10
-
11
-
12
-
13
-
14
-
15
-
16
-
17
-
18
-
19
-
20
-
21
-
22
-
23
-
24
-
25
-
26
-
27
-
28
-
29
-
30
-
31
-
32
-
33
-
34
-
35
-
36
-
37
-
38
-
39
-
40
-
41
-
42
-
43
-
44
-
45
-
46
-
47
-
48
-
49
-
50
-
51
-
52
-
53
-
54
-
55
-
56
-
57
-
58
-
59
-
60
-
61
-
62
-
63
-
64
-
65
-
66
-
67
-
68
-
69
-
70
-
71
-
72
-
73
-
74
-
75
-
76
-
 77
77 -
 78
78 -
 79
79 -
 80
80 -
 81
81 -
 82
82 -
 83
83 -
 84
84 -
 85
85 -
 86
86 -
 87
87 -
 88
88 -
 89
89 -
 90
90 -
 91
91 -
 92
92 -
 93
93 -
 94
94 -
 95
95 -
 96
96 -
 97
97 -
98
-
99
-
100
-
101
-
102
-
103
-
104
-
105
-
106
-
107
-
108
-
109
-
110
-
111
-
112
-
113
-
114
-
115
-
116
-
117
-
118
-
119
-
120
-
121
-
122
-
123
-
124
-
125
-
126
-
127
-
128
-
129
-
130
-
131
-
132
-
133
-
134
-
135
-
136
-
137
-
138
-
139
-
140
-
141
-
142
-
143
-
144
-
145
-
146
-
147
-
148
-
149
-
150
-
151
-
152
-
153
-
154
-
155
-
156
-
157
-
158
-
159
-
160
-
161
-
162
-
163
-
164
-
165
-
166
-
167
-
168
-
169
-
170
-
171
-
172
-
173
-
174
-
175
-
176
-
177
-
178
-
179
-
180
-
181
-
182
-
183
-
184
-
185
-
186
-
187
-
188
-
189
-
190
-
191
-
192
-
193
-
194
-
195
-
196
-
197
-
198
-
199
 |
 |

64
decreased to $4.2 billion at December 31, 2014 from $4.9 billion
at December 31, 2013.
As mentioned above, the Bank and Parent Company
maintain programs to access the debt capital markets. The Parent
Company maintains a SEC shelf registration from which it may
issue senior or subordinated notes and various capital securities
such as common or preferred stock. Our Board has authorized
the issuance of up to $5.0 billion of such securities, of which
approximately $2.4 billion of issuance capacity remained
available at December 31, 2014.
The Bank maintains a Global Bank Note program under
which it may issue senior or subordinated debt with various
terms. At December 31, 2014, the Bank retained $35.4 billion of
remaining capacity to issue notes under the Global Bank Note
program.
Our issuance capacity under these Bank and Parent
Company programs refers to authorization granted by our Board,
which is formal program capacity and not a commitment to
purchase by any investor. Debt and equity securities issued under
these programs are designed to appeal primarily to domestic and
international institutional investors. Institutional investor
demand for these securities depends upon numerous factors,
including but not limited to our credit ratings and investor
perception of financial market conditions and the health of the
banking sector. Therefore, our ability to access these markets in
the future could be impaired for either systemic or idiosyncratic
reasons.
We assess liquidity needs that may occur in both the normal
course of business and times of unusual adverse events,
considering both on and off-balance sheet arrangements and
commitments that may impact liquidity in certain business
environments. We have contingency funding scenarios and plans
that assess liquidity needs that may arise from certain stress
events such as severe economic recessions, financial market
disruptions, and credit rating downgrades. In particular, a ratings
downgrade could adversely impact the cost and availability of
some of our liquid funding sources. Factors that affect our credit
ratings include, but are not limited to, the credit risk profile of
our assets, the adequacy of our ALLL, the level and stability of
our earnings, the liquidity profile of both the Bank and the Parent
Company, the economic environment, and the adequacy of our
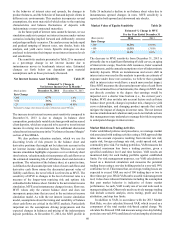
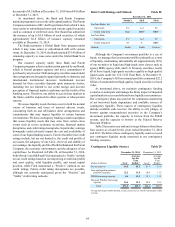
capital base. As illustrated in Table 28, at December 31, 2014,
both Moody’s and S&P and Fitch maintained a "Stable" outlook
on our credit ratings based on our improving overall risk profile
and asset quality, solid liquidity profile, and sound capital
position, while Fitch maintained a “Positive” outlook on our
credit ratings. Future credit rating downgrades are possible,
although not currently anticipated given the “Positive” and
“Stable” credit rating outlooks.
Debt Credit Ratings and Outlook Table 28
December 31, 2014
Moody’s S&P Fitch
SunTrust Banks, Inc.
Short-term P-2 A-2 F2
Senior long-term Baa1 BBB+ BBB+
SunTrust Bank
Short-term P-2 A-2 F2
Senior long-term A3 A- BBB+
Outlook Stable Stable Positive
Although the Company's investment portfolio is a use of
funds, we manage that investment portfolio primarily as a store
of liquidity, maintaining substantially all (approximately 96%)
of our securities in liquid and high-grade asset classes such as
agency MBS, agency debt, and U.S. Treasury securities; nearly
all of those liquid, high-grade securities qualify as high-quality
liquid assets under the U.S. LCR Final Rule. At December 31,
2014, the Company's AFS investment portfolio contained $22.2
billion of unencumbered high-quality, liquid securities at book
value.
As mentioned above, we maintain contingency funding
scenarios to anticipate and manage the likely impact of impaired
capital markets access and other adverse liquidity circumstances.
Our contingency plans also provide for continuous monitoring
of net borrowed funds dependence and available sources of
contingency liquidity. These sources of contingency liquidity
include available cash reserves; the ability to sell, pledge, or
borrow against unencumbered securities in the Company’s
investment portfolio; the capacity to borrow from the FHLB
system; and the capacity to borrow at the Federal Reserve
Discount Window.
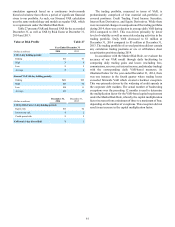
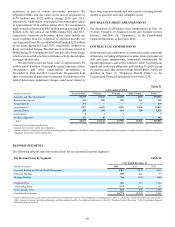
Table 29 presents year end and average balances from these
four sources as of and for the years ended December 31, 2014
and 2013. We believe these contingency liquidity sources exceed
any contingent liquidity needs measured in our contingency
funding scenarios.
Contingency Liquidity Sources Table 29
December 31, 2014 December 31, 2013
(Dollars in billions) As of
Average
for the
Year
Ended ¹ As of
Average
for the
Year
Ended ¹
Excess reserves $4.5 $3.5 $1.3 $1.6
Free and liquid investment
portfolio securities 22.2 13.8 10.0 11.5
FHLB borrowing capacity 8.4 13.2 12.3 13.1
Discount Window borrowing
capacity 18.4 19.2 20.8 19.5
Total $53.5 $49.7 $44.4 $45.7
1 Average based upon month-end data, except excess reserves, which is based upon a daily
average.