SunTrust 2014 Annual Report Download - page 128
Download and view the complete annual report
Please find page 128 of the 2014 SunTrust annual report below. You can navigate through the pages in the report by either clicking on the pages listed below, or by using the keyword search tool below to find specific information within the annual report.-
 1
1 -
2
-
3
-
4
-
5
-
6
-
7
-
8
-
9
-
10
-
11
-
12
-
13
-
14
-
15
-
16
-
17
-
18
-
19
-
20
-
21
-
22
-
23
-
24
-
25
-
26
-
27
-
28
-
29
-
30
-
31
-
32
-
33
-
34
-
35
-
36
-
37
-
38
-
39
-
40
-
41
-
42
-
43
-
44
-
45
-
46
-
47
-
48
-
49
-
50
-
51
-
52
-
53
-
54
-
55
-
56
-
57
-
58
-
59
-
60
-
61
-
62
-
63
-
64
-
65
-
66
-
67
-
68
-
69
-
70
-
71
-
72
-
73
-
74
-
75
-
76
-
77
-
78
-
79
-
80
-
81
-
82
-
83
-
84
-
85
-
86
-
87
-
88
-
89
-
90
-
91
-
92
-
93
-
94
-
95
-
96
-
97
-
98
-
99
-
100
-
101
-
102
-
103
-
104
-
105
-
106
-
107
-
108
-
109
-
110
-
111
-
112
-
113
-
114
-
115
-
116
-
117
-
 118
118 -
 119
119 -
 120
120 -
 121
121 -
 122
122 -
 123
123 -
 124
124 -
 125
125 -
 126
126 -
 127
127 -
 128
128 -
 129
129 -
 130
130 -
 131
131 -
 132
132 -
 133
133 -
 134
134 -
 135
135 -
 136
136 -
 137
137 -
 138
138 -
139
-
140
-
141
-
142
-
143
-
144
-
145
-
146
-
147
-
148
-
149
-
150
-
151
-
152
-
153
-
154
-
155
-
156
-
157
-
158
-
159
-
160
-
161
-
162
-
163
-
164
-
165
-
166
-
167
-
168
-
169
-
170
-
171
-
172
-
173
-
174
-
175
-
176
-
177
-
178
-
179
-
180
-
181
-
182
-
183
-
184
-
185
-
186
-
187
-
188
-
189
-
190
-
191
-
192
-
193
-
194
-
195
-
196
-
197
-
198
-
199
 |
 |
Notes to Consolidated Financial Statements, continued
105
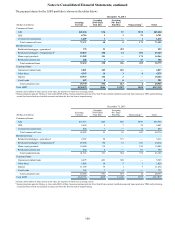
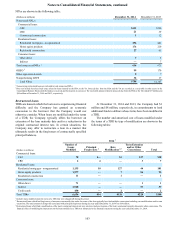
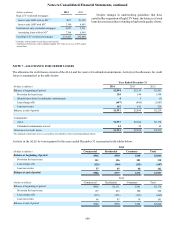
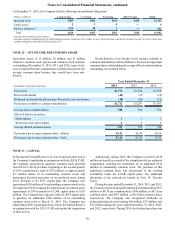
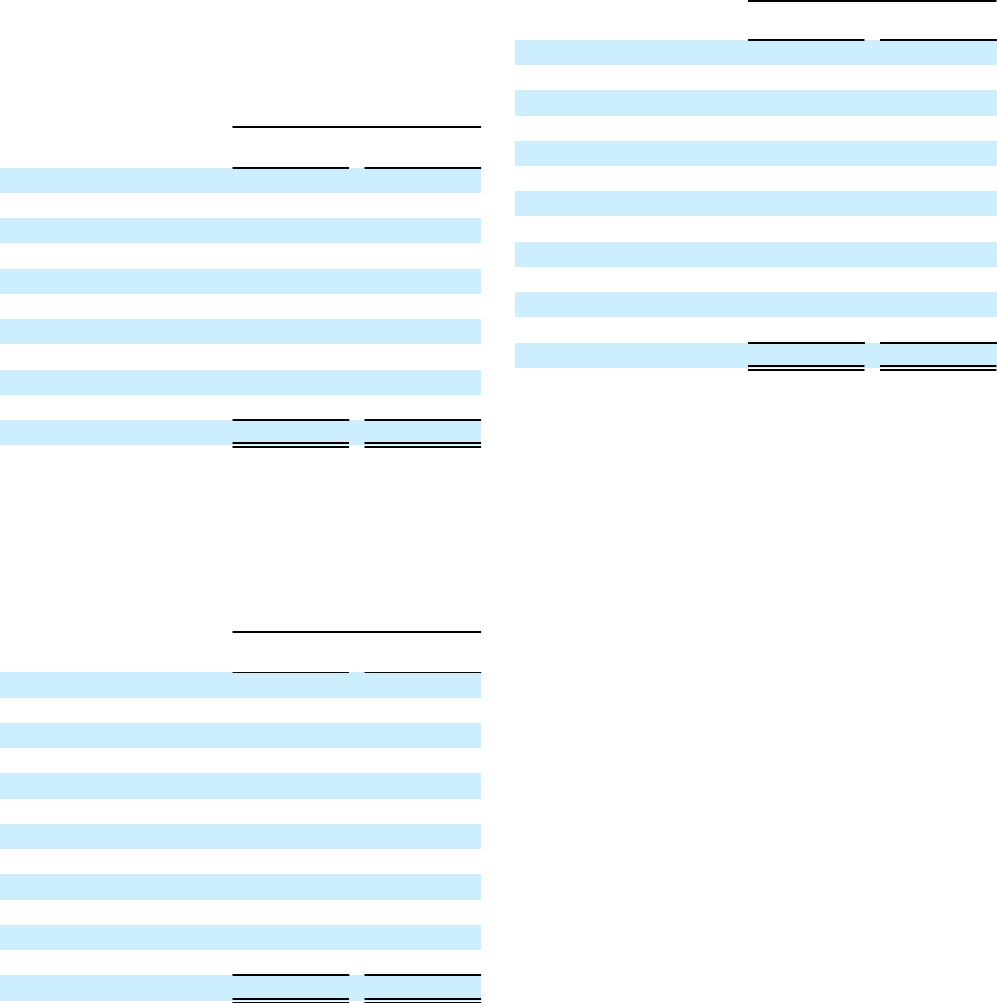
For the year ended December 31, 2014, the table below
represents defaults on loans that were first modified between
the periods January 1, 2013 and December 31, 2014 that
became 90 days or more delinquent or were charged-off during
the period.
Year Ended December 31, 2014
(Dollars in millions) Number of
Loans Amortized
Cost
Commercial loans:
C&I 78 $10
Residential loans:
Residential mortgages 158 19
Home equity products 101 5
Residential construction 6 —
Consumer loans:
Other direct 9 —
Indirect 181 1
Credit cards 145 1
Total TDRs 678 $36
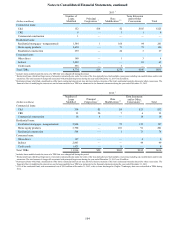
For the year ended December 31, 2013, the table below
represents defaults on loans that were first modified between
the periods January 1, 2012 and December 31, 2013 that
became 90 days or more delinquent or were charged-off during
the period.
Year Ended December 31, 2013
(Dollars in millions) Number of
Loans Amortized
Cost
Commercial loans:
C&I 55 $5
CRE 5 3
Commercial construction 1 —
Residential loans:
Residential mortgages 287 23
Home equity products 188 10
Residential construction 48 3
Consumer loans:
Other direct 15 1
Indirect 207 2
Credit cards 169 1
Total TDRs 975 $48
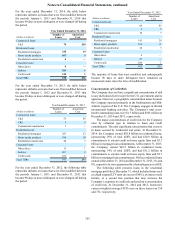
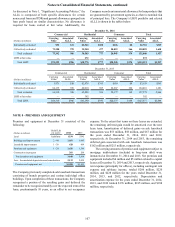
For the year ended December 31, 2012, the following table
represents defaults on loans that were first modified between
the periods January 1, 2011 and December 31, 2012 that
became 90 days or more delinquent or were charged-off during
the period.
Year Ended December 31, 2012
(Dollars in millions) Number of
Loans Amortized
Cost
Commercial loans:
C&I 84 $5
CRE 9 5
Commercial construction 10 7
Residential loans:
Residential mortgages 141 20
Home equity products 164 11
Residential construction 24 3
Consumer loans:
Other direct 4 —
Indirect 43 —
Credit cards 204 1
Total TDRs 683 $52
The majority of loans that were modified and subsequently
became 90 days or more delinquent have remained on
nonaccrual status since the time of modification.
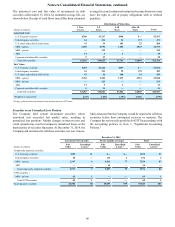
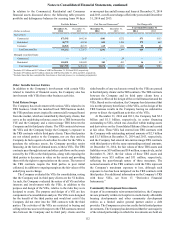
Concentrations of Credit Risk
The Company does not have a significant concentration of risk
to any individual client except for the U.S. government and its
agencies. However, a geographic concentration arises because
the Company operates primarily in the Southeastern and Mid-
Atlantic regions of the U.S. The Company engages in limited
international banking activities. The Company’s total cross-
border outstanding loans were $1.3 billion and $956 million at
December 31, 2014 and 2013, respectively.
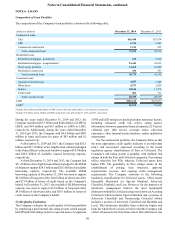
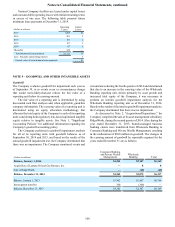
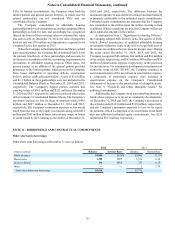
The major concentrations of credit risk for the Company
arise by collateral type in relation to loans and credit
commitments. The only significant concentration that exists is
in loans secured by residential real estate. At December 31,
2014, the Company owned $38.8 billion in residential loans,
representing 29% of total LHFI, and had $10.9 billion in
commitments to extend credit on home equity lines and $3.3
billion in mortgage loan commitments. At December 31, 2013,
the Company owned $43.2 billion in residential loans,
representing 34% of total LHFI, and had $11.2 billion in
commitments to extend credit on home equity lines and $2.7
billion in mortgage loan commitments. Of the residential loans
owned at December 31, 2014 and December 31, 2013, 2% and
8%, respectively, were guaranteed by a federal agency or a GSE.
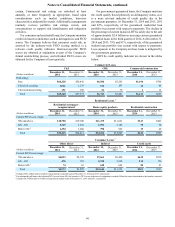
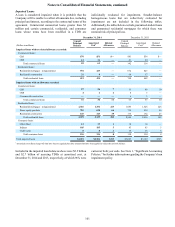
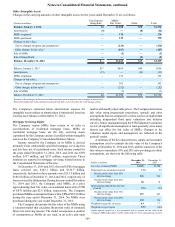
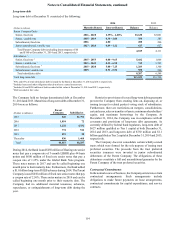
The following table presents loans in the residential
mortgage portfolio at December 31, which included terms such
as a high original LTV ratio (in excess of 80%), an interest only
feature, or a second lien position that may increase the
Company’s exposure to credit risk and result in a concentration
of credit risk. At December 31, 2014 and 2013, borrowers'
current weighted average FICO score on these loans was 754
and 732, respectively.