SunTrust 2014 Annual Report Download - page 96
Download and view the complete annual report
Please find page 96 of the 2014 SunTrust annual report below. You can navigate through the pages in the report by either clicking on the pages listed below, or by using the keyword search tool below to find specific information within the annual report.-
 1
1 -
2
-
3
-
4
-
5
-
6
-
7
-
8
-
9
-
10
-
11
-
12
-
13
-
14
-
15
-
16
-
17
-
18
-
19
-
20
-
21
-
22
-
23
-
24
-
25
-
26
-
27
-
28
-
29
-
30
-
31
-
32
-
33
-
34
-
35
-
36
-
37
-
38
-
39
-
40
-
41
-
42
-
43
-
44
-
45
-
46
-
47
-
48
-
49
-
50
-
51
-
52
-
53
-
54
-
55
-
56
-
57
-
58
-
59
-
60
-
61
-
62
-
63
-
64
-
65
-
66
-
67
-
68
-
69
-
70
-
71
-
72
-
73
-
74
-
75
-
76
-
77
-
78
-
79
-
80
-
81
-
82
-
83
-
84
-
85
-
 86
86 -
 87
87 -
 88
88 -
 89
89 -
 90
90 -
 91
91 -
 92
92 -
 93
93 -
 94
94 -
 95
95 -
 96
96 -
 97
97 -
 98
98 -
 99
99 -
 100
100 -
 101
101 -
 102
102 -
 103
103 -
 104
104 -
 105
105 -
 106
106 -
107
-
108
-
109
-
110
-
111
-
112
-
113
-
114
-
115
-
116
-
117
-
118
-
119
-
120
-
121
-
122
-
123
-
124
-
125
-
126
-
127
-
128
-
129
-
130
-
131
-
132
-
133
-
134
-
135
-
136
-
137
-
138
-
139
-
140
-
141
-
142
-
143
-
144
-
145
-
146
-
147
-
148
-
149
-
150
-
151
-
152
-
153
-
154
-
155
-
156
-
157
-
158
-
159
-
160
-
161
-
162
-
163
-
164
-
165
-
166
-
167
-
168
-
169
-
170
-
171
-
172
-
173
-
174
-
175
-
176
-
177
-
178
-
179
-
180
-
181
-
182
-
183
-
184
-
185
-
186
-
187
-
188
-
189
-
190
-
191
-
192
-
193
-
194
-
195
-
196
-
197
-
198
-
199
 |
 |
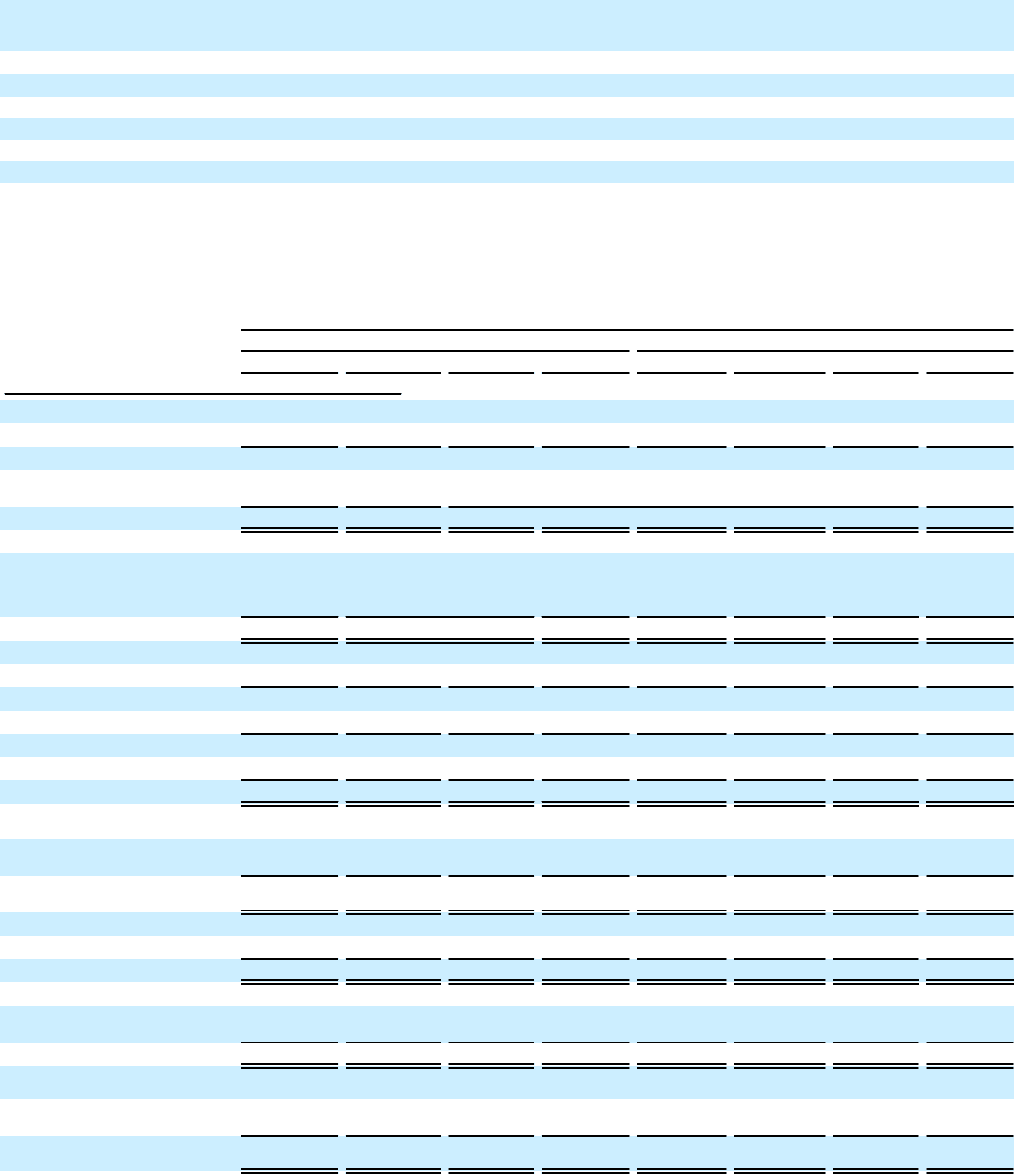
73
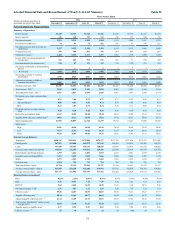
ALLL to period-end total loans 1.46 1.49 1.55 1.58 1.60 1.67 1.75 1.79
Total NPAs to total loans plus OREO,
other repossessed assets, and
nonperforming LHFS 0.59 0.71 0.80 0.85 0.91 1.04 1.14 1.44
Common dividend payout ratio 27.7 18.8 27.5 13.6 13.0 30.1 14.8 7.9
Capital Ratios:
Tier 1 common equity 9.60% 9.63% 9.72% 9.90% 9.82% 9.94% 10.19% 10.13%
Tier 1 capital 10.80 10.54 10.66 10.88 10.81 10.97 11.24 11.20
Total capital 12.51 12.32 12.53 12.81 12.81 13.04 13.43 13.45
Tier 1 leverage 9.64 9.51 9.56 9.57 9.58 9.46 9.40 9.26
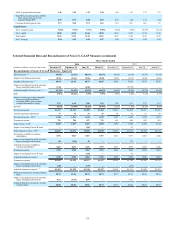
Selected Financial Data and Reconcilement of Non-U.S. GAAP Measures (continued)
Three Months Ended
(Dollars in millions, except per share data)
2014 2013
December 31 September 30 June 30 March 31 December 31 September 30 June 30 March 31
Reconcilement of Non-U.S. GAAP Measures - Quarterly
Efficiency ratio 1, 6 69.00% 62.03% 68.93% 66.83% 66.05% 90.13% 66.07% 63.97%
Impact of excluding amortization (0.56) (0.34) (0.16) (0.18) (0.21)(0.31)(0.29) (0.29)
Tangible efficiency ratio 1, 7 68.44 61.69 68.77 66.65 65.84 89.82 65.78 63.68
Impact of excluding Form 8-K and other
legacy mortgage-related items (7.10) — (5.08) — —(23.98) — —
Adjusted tangible efficiency ratio 1, 2, 7 61.34% 61.69% 63.69% 66.65% 65.84% 65.84% 65.78% 63.68%
ROE 6.91% 10.41% 7.29% 7.59% 7.99% 3.49% 7.12% 6.77%
Impact of removing average intangible
assets (net of deferred taxes),
excluding MSRs, from average
common shareholders' equity 2.71 4.18 3.00 3.19 3.62 1.61 3.23 3.11
ROTCE 5 9.62% 14.59% 10.29% 10.78% 11.61% 5.10% 10.35% 9.88%
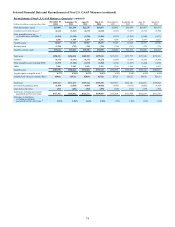
Net interest income $1,211 $1,215 $1,209 $1,204 $1,213 $1,208 $1,211 $1,221
Taxable-equivalent adjustment 37 36 35 35 34 32 31 30
Net interest income - FTE 3 1,248 1,251 1,244 1,239 1,247 1,240 1,242 1,251
Noninterest income 795 780 957 791 814 680 858 863
Total revenue - FTE 32,043 2,031 2,201 2,030 2,061 1,920 2,100 2,114
Impact of excluding Form 8-K items — — (105) — — 63 — —
Total adjusted revenue - FTE 2, 3 $2,043 $2,031 $2,096 $2,030 $2,061 $1,983 $2,100 $2,114
Net income available to common
shareholders $378 $563 $387 $393 $413 $179 $365 $340
Impact of excluding Form 8-K and other
legacy mortgage-related items 88 (130) 49 — — 179 — —
Adjusted net income available to
common shareholders 2 $466 $433 $436 $393 $413 $358 $365 $340
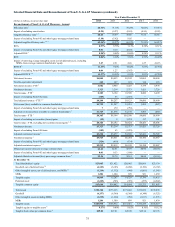
Noninterest income $795 $780 $957 $791 $814 $680 $858 $863
Impact of excluding Form 8-K items — — (105) — — 63 — —
Adjusted noninterest income 2 $795 $780 $852 $791 $814 $743 $858 $863
Noninterest expense 1$1,410 $1,259 $1,517 $1,357 $1,361 $1,730 $1,388 $1,352
Impact of excluding Form 8-K and other
legacy mortgage-related items (145) — (179) — —(419) — —
Adjusted noninterest expense 1, 2 $1,265 $1,259 $1,338 $1,357 $1,361 $1,311 $1,388 $1,352
Diluted net income per average common
share $0.72 $1.06 $0.72 $0.73 $0.77 $0.33 $0.68 $0.63
Impact of excluding Form 8-K and other
legacy mortgage-related items 0.16 (0.25) 0.09 — — 0.33 — —
Adjusted diluted net income per average
common share 2 $0.88 $0.81 $0.81 $0.73 $0.77 $0.66 $0.68 $0.63