SunTrust 2014 Annual Report Download - page 46
Download and view the complete annual report
Please find page 46 of the 2014 SunTrust annual report below. You can navigate through the pages in the report by either clicking on the pages listed below, or by using the keyword search tool below to find specific information within the annual report.-
 1
1 -
2
-
3
-
4
-
5
-
6
-
7
-
8
-
9
-
10
-
11
-
12
-
13
-
14
-
15
-
16
-
17
-
18
-
19
-
20
-
21
-
22
-
23
-
24
-
25
-
26
-
27
-
28
-
29
-
30
-
31
-
32
-
33
-
34
-
35
-
 36
36 -
 37
37 -
 38
38 -
 39
39 -
 40
40 -
 41
41 -
 42
42 -
 43
43 -
 44
44 -
 45
45 -
 46
46 -
 47
47 -
 48
48 -
 49
49 -
 50
50 -
 51
51 -
 52
52 -
 53
53 -
 54
54 -
 55
55 -
 56
56 -
57
-
58
-
59
-
60
-
61
-
62
-
63
-
64
-
65
-
66
-
67
-
68
-
69
-
70
-
71
-
72
-
73
-
74
-
75
-
76
-
77
-
78
-
79
-
80
-
81
-
82
-
83
-
84
-
85
-
86
-
87
-
88
-
89
-
90
-
91
-
92
-
93
-
94
-
95
-
96
-
97
-
98
-
99
-
100
-
101
-
102
-
103
-
104
-
105
-
106
-
107
-
108
-
109
-
110
-
111
-
112
-
113
-
114
-
115
-
116
-
117
-
118
-
119
-
120
-
121
-
122
-
123
-
124
-
125
-
126
-
127
-
128
-
129
-
130
-
131
-
132
-
133
-
134
-
135
-
136
-
137
-
138
-
139
-
140
-
141
-
142
-
143
-
144
-
145
-
146
-
147
-
148
-
149
-
150
-
151
-
152
-
153
-
154
-
155
-
156
-
157
-
158
-
159
-
160
-
161
-
162
-
163
-
164
-
165
-
166
-
167
-
168
-
169
-
170
-
171
-
172
-
173
-
174
-
175
-
176
-
177
-
178
-
179
-
180
-
181
-
182
-
183
-
184
-
185
-
186
-
187
-
188
-
189
-
190
-
191
-
192
-
193
-
194
-
195
-
196
-
197
-
198
-
199
 |
 |

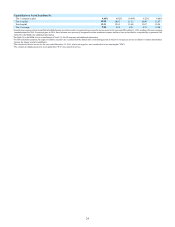
23
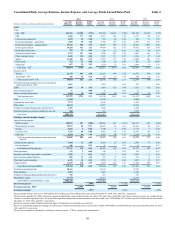
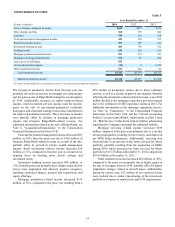
Item 6. SELECTED FINANCIAL DATA
Year Ended December 31
(Dollars in millions and shares in thousands, except per share data) 2014 2013 2012 2011 2010
Summary of Operations:
Interest income $5,384 $5,388 $5,867 $6,181 $6,343
Interest expense 544 535 765 1,116 1,489
Net interest income 4,840 4,853 5,102 5,065 4,854
Provision for credit losses 342 553 1,395 1,513 2,651
Net interest income after provision for credit losses 4,498 4,300 3,707 3,552 2,203
Noninterest income 3,323 3,214 5,373 3,421 3,729
Noninterest expense 15,543 5,831 6,284 6,194 5,867
Income before provision/(benefit) for income taxes 2,278 1,683 2,796 779 65
Provision/(benefit) for income taxes 1493 322 812 119 (141)
Net income attributable to noncontrolling interest 11 17 26 13 17
Net income $1,774 $1,344 $1,958 $647 $189
Net income/(loss) available to common shareholders $1,722 $1,297 $1,931 $495 ($87)
Adjusted net income/(loss) available to common shareholders 2$1,729 $1,476 $1,178 $495 ($87)
Net interest income - FTE 2$4,982 $4,980 $5,225 $5,179 $4,970
Total revenue - FTE 28,305 8,194 10,598 8,600 8,699
Total revenue - FTE, excluding net securities (losses)/gains 2 8,320 8,192 8,624 8,483 8,508
Total adjusted revenue - FTE 28,200 8,257 9,123 8,600 8,699
Net income/(loss) per average common share:
Diluted 33.23 2.41 3.59 0.94 (0.18)
Adjusted diluted 2, 3 3.24 2.74 2.19 0.94 (0.18)
Basic 3.26 2.43 3.62 0.94 (0.18)
Dividends paid per average common share 0.70 0.35 0.20 0.12 0.04
Book value per common share 41.52 38.61 37.59 36.86 36.34
Tangible book value per common share 229.82 27.01 25.98 25.18 23.76
Market capitalization 21,978 19,734 15,279 9,504 14,768
Market price:
High 43.06 36.99 30.79 33.14 31.92
Low 33.97 26.93 18.07 15.79 20.16
Close 41.90 36.81 28.35 17.70 29.51
Period End Balances:
Total assets $190,328 $175,335 $173,442 $176,859 $172,874
Earning assets 168,678 156,856 151,223 154,696 148,473
Loans 133,112 127,877 121,470 122,495 115,975
ALLL 1,937 2,044 2,174 2,457 2,974
Consumer and commercial deposits 139,234 127,735 130,180 125,611 120,025
Brokered time and foreign deposits 1,333 2,024 2,136 2,311 3,019
Long-term debt 13,022 10,700 9,357 10,908 13,648
Total shareholders’ equity 23,005 21,422 20,985 20,066 23,130
Selected Average Balances:
Total assets $182,176 $172,497 $176,134 $172,440 $172,375
Earning assets 162,189 153,728 153,479 147,802 147,187
Loans 130,874 122,657 122,893 116,308 113,925
Consumer and commercial deposits 132,012 127,076 126,249 122,672 117,129
Brokered time and foreign deposits 1,730 2,065 2,255 2,386 2,916
Intangible assets including MSRs 7,630 7,535 7,322 7,780 7,837
MSRs 1,255 1,121 887 1,331 1,317
Preferred stock 800 725 290 1,328 4,929
Total shareholders’ equity 22,170 21,167 20,495 20,696 22,834
Average common shares - diluted 533,391 539,093 538,061 527,618 498,744
Average common shares - basic 527,500 534,283 534,149 523,995 495,361
Financial Ratios:
Effective tax rate 1, 4 22% 19% 29% 16% NM
ROA 0.97 0.78 1.11 0.38 0.11
ROE 8.06 6.34 9.56 2.56 (0.49)
ROTCE 211.33 9.25 14.02 3.83 (0.76)
Net interest margin - FTE 23.07 3.24 3.40 3.50 3.38
Efficiency ratio 1 66.74 71.16 59.29 72.02 67.44
Tangible efficiency ratio 1, 266.44 70.89 58.86 71.52 66.85
Adjusted tangible efficiency ratio 1, 263.34 65.27 66.91 71.52 66.85
Total average shareholders’ equity to total average assets 12.17 12.27 11.64 12.00 13.25
Tangible equity to tangible assets 29.17 9.00 8.82 8.10 10.12
ALLL to period-end loans 1.46 1.60 1.80 2.01 2.58
NPAs to period-end loans, OREO, other repossessed assets, and nonperforming LHFS 0.59 0.91 1.52 2.76 4.08
Common dividend payout ratio 521.5 14.5 5.6 12.9 N/A