SunTrust 2014 Annual Report Download - page 50
Download and view the complete annual report
Please find page 50 of the 2014 SunTrust annual report below. You can navigate through the pages in the report by either clicking on the pages listed below, or by using the keyword search tool below to find specific information within the annual report.-
 1
1 -
2
-
3
-
4
-
5
-
6
-
7
-
8
-
9
-
10
-
11
-
12
-
13
-
14
-
15
-
16
-
17
-
18
-
19
-
20
-
21
-
22
-
23
-
24
-
25
-
26
-
27
-
28
-
29
-
30
-
31
-
32
-
33
-
34
-
35
-
36
-
37
-
38
-
39
-
 40
40 -
 41
41 -
 42
42 -
 43
43 -
 44
44 -
 45
45 -
 46
46 -
 47
47 -
 48
48 -
 49
49 -
 50
50 -
 51
51 -
 52
52 -
 53
53 -
 54
54 -
 55
55 -
 56
56 -
 57
57 -
 58
58 -
 59
59 -
 60
60 -
61
-
62
-
63
-
64
-
65
-
66
-
67
-
68
-
69
-
70
-
71
-
72
-
73
-
74
-
75
-
76
-
77
-
78
-
79
-
80
-
81
-
82
-
83
-
84
-
85
-
86
-
87
-
88
-
89
-
90
-
91
-
92
-
93
-
94
-
95
-
96
-
97
-
98
-
99
-
100
-
101
-
102
-
103
-
104
-
105
-
106
-
107
-
108
-
109
-
110
-
111
-
112
-
113
-
114
-
115
-
116
-
117
-
118
-
119
-
120
-
121
-
122
-
123
-
124
-
125
-
126
-
127
-
128
-
129
-
130
-
131
-
132
-
133
-
134
-
135
-
136
-
137
-
138
-
139
-
140
-
141
-
142
-
143
-
144
-
145
-
146
-
147
-
148
-
149
-
150
-
151
-
152
-
153
-
154
-
155
-
156
-
157
-
158
-
159
-
160
-
161
-
162
-
163
-
164
-
165
-
166
-
167
-
168
-
169
-
170
-
171
-
172
-
173
-
174
-
175
-
176
-
177
-
178
-
179
-
180
-
181
-
182
-
183
-
184
-
185
-
186
-
187
-
188
-
189
-
190
-
191
-
192
-
193
-
194
-
195
-
196
-
197
-
198
-
199
 |
 |
27
helped to offset the negative impact of the sustained low rate
environment on revenues. These favorable developments helped
enable us to double the capital return for our shareholders by
increasing our dividend and buying back more shares.
Separately, we addressed several outstanding legacy mortgage-
related matters, including a fourth quarter legal provision to
increase legal reserves and complete the resolution of a specific
matter.
Our net income available to common shareholders totaled
$1.7 billion for 2014, an increase of 33% compared to 2013, with
diluted earnings per average common share of $3.23, up 34%
from the prior year. Our core earnings growth during 2014
reflected our focus on expanding client relationships and
executing our core strategies. Coming into 2014, we faced
several meaningful revenue headwinds, namely the end of
elevated mortgage refinance activity and the ongoing impact of
the prolonged low rate environment on net interest margin.
However, we remained focused on the commitments that we
made to our stakeholders, and we delivered on those goals.
Noteworthy 2014 items included:
• We delivered 33% earnings growth;
• Noninterest expense decreased $288 million compared to the
prior year;
• We delivered on our announced 2014 efficiency ratio
commitment, with an adjusted tangible efficiency ratio below
64%;
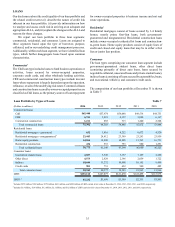
• Average total loans increased 7% compared to the prior year,
driven by growth in C&I, CRE, and consumer loans;
• Average consumer and commercial deposits increased 4%
compared to the prior year, with the favorable mix shift toward
lower-cost deposits continuing;
• We maintained strong capital ratios that continue to be well
above regulatory requirements, with our Basel I Tier 1
common and estimated, fully phased-in Basel III CET 1 ratios
at 9.60% and 9.69%, respectively;
• We repurchased $458 million of common shares and issued
$500 million of preferred stock;
• Tangible book value per share was $29.82, up 10% from the
prior year;
• Asset quality continued to improve as NPLs declined 35%
from the prior year and totaled 0.48% of total loans;
• Net charge-offs were down $233 million, or 34%, compared
to 2013, representing 0.34% of average loans, down 21 basis
points from the prior year;
• Our LCR is already above the January 1, 2016 requirement of
90%;
• We resolved many legacy mortgage-related issues; and
• Our ROA and ROTCE improved by 19 and 208 basis points
compared to the prior year, to 0.97% and 11.33%, respectively.
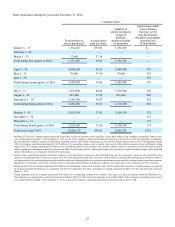
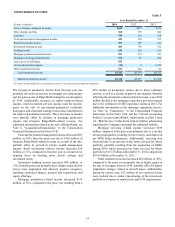
Our 2014 and 2013 results included several matters of a non-
core nature that were separately disclosed in Forms 8-K. A
summary of the Form 8-K and other legacy mortgage-related
items that impacted our current and prior years' results are
presented in Table 1. When excluding these items from each
year's results, our diluted earnings per common share increased
18% during 2014, compared to 2013. Refer to Table 34, "Selected
Financial Data and Reconcilement of Non-U.S. GAAP
Measures," in this MD&A for additional detail and the resulting
impacts of Form 8-K and other legacy mortgage-related items
on our financial results.
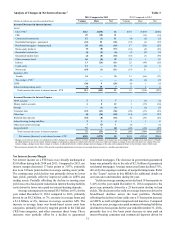
Table 1
Year Ended
December 31
(Dollars in millions, except per share amounts) 2014 2013
Net income available to common shareholders $1,722 $1,297
Form 8-K and other legacy mortgage-related items
impacting the periods:
Charges for legacy mortgage-related matters 324 482
Gain on sale of RidgeWorth (105) —
Tax benefit related to above items (82) (190)
Tax benefit related to completion of tax authority
examination (130) —
Net tax benefit related to subsidiary reorganization
and other —(113)
Adjusted net income available to common
shareholders $1,729 $1,476
Net income per average common share, diluted $3.23 $2.41
Adjusted net income per average common share,
diluted $3.24 $2.74
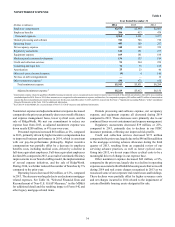
Total revenue increased $111 million during 2014 compared to
the prior year. Total adjusted revenue decreased $57 million
during the year, compared to 2013. The slight decrease was
primarily driven by foregone RidgeWorth revenue and
significantly lower mortgage production income resulting from
a 45% decline in production volume due to lower refinance
activity. Largely offsetting these reductions were higher
investment banking, mortgage servicing, and retail investment
services income, as well as gains on the sale of mortgage LHFS.
Net interest income for 2014 was relatively flat compared to
2013, as strong loan growth offset a 17 basis point decline in net
interest margin. Looking forward, we expect net interest margin
in the first quarter of 2015 to decline from the fourth quarter
2014 level, driven primarily by lower commercial loan swap
income. We will continue to carefully manage the usage and
sensitivity of our balance sheet in light of the continued low
interest rate environment, while also being cognizant of
controlling interest rate risk in advance of what we expect will
eventually be higher interest rates. See additional discussion
related to revenue, noninterest income, and net interest income
and margin in the "Noninterest Income" and "Net Interest
Income/Margin" sections of this MD&A. Also in this MD&A,
see Table 25, "Net Interest Income Asset Sensitivity," for an
analysis of potential changes in net interest income due to
instantaneous moves in benchmark interest rates, as well as Table
34, "Selected Financial Data and Reconcilement of Non-U.S.
GAAP Measures," for reconciliations of adjusted diluted net
income per average common share and total adjusted revenue.
We met our commitment to reduce our expense base from 2013,
as noninterest expense decreased $288 million, or 5%, and
adjusted noninterest expense decreased $193 million, or 4%,
compared to the prior year. These reductions reflect a
combination of our efficiency efforts, lower cyclical costs, and
the sale of RidgeWorth, partially offset by higher incentive
compensation due to improved business performance in 2014,
as well as our investments in key growth areas. As we look to
2015, we do not expect core expenses to decline from the 2014