SunTrust 2014 Annual Report Download - page 84
Download and view the complete annual report
Please find page 84 of the 2014 SunTrust annual report below. You can navigate through the pages in the report by either clicking on the pages listed below, or by using the keyword search tool below to find specific information within the annual report.-
 1
1 -
2
-
3
-
4
-
5
-
6
-
7
-
8
-
9
-
10
-
11
-
12
-
13
-
14
-
15
-
16
-
17
-
18
-
19
-
20
-
21
-
22
-
23
-
24
-
25
-
26
-
27
-
28
-
29
-
30
-
31
-
32
-
33
-
34
-
35
-
36
-
37
-
38
-
39
-
40
-
41
-
42
-
43
-
44
-
45
-
46
-
47
-
48
-
49
-
50
-
51
-
52
-
53
-
54
-
55
-
56
-
57
-
58
-
59
-
60
-
61
-
62
-
63
-
64
-
65
-
66
-
67
-
68
-
69
-
70
-
71
-
72
-
73
-
 74
74 -
 75
75 -
 76
76 -
 77
77 -
 78
78 -
 79
79 -
 80
80 -
 81
81 -
 82
82 -
 83
83 -
 84
84 -
 85
85 -
 86
86 -
 87
87 -
 88
88 -
 89
89 -
 90
90 -
 91
91 -
 92
92 -
 93
93 -
 94
94 -
95
-
96
-
97
-
98
-
99
-
100
-
101
-
102
-
103
-
104
-
105
-
106
-
107
-
108
-
109
-
110
-
111
-
112
-
113
-
114
-
115
-
116
-
117
-
118
-
119
-
120
-
121
-
122
-
123
-
124
-
125
-
126
-
127
-
128
-
129
-
130
-
131
-
132
-
133
-
134
-
135
-
136
-
137
-
138
-
139
-
140
-
141
-
142
-
143
-
144
-
145
-
146
-
147
-
148
-
149
-
150
-
151
-
152
-
153
-
154
-
155
-
156
-
157
-
158
-
159
-
160
-
161
-
162
-
163
-
164
-
165
-
166
-
167
-
168
-
169
-
170
-
171
-
172
-
173
-
174
-
175
-
176
-
177
-
178
-
179
-
180
-
181
-
182
-
183
-
184
-
185
-
186
-
187
-
188
-
189
-
190
-
191
-
192
-
193
-
194
-
195
-
196
-
197
-
198
-
199
 |
 |
61
simulation approach based on a continuous twelve-month
historical window that reflects a period of significant financial
stress to our portfolio. As such, our Stressed VAR calculation
uses the same methodology and models as regular VAR, which
is a requirement under the Market Risk Rule.
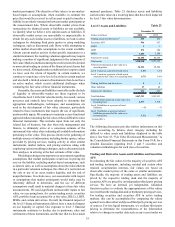
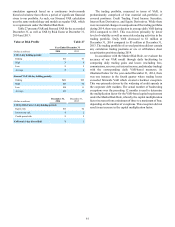
Table 27 presents VAR and Stressed VAR for the year ended
December 31, as well as VAR by Risk Factor at December 31,
2014 and 2013:
Value at Risk Profile Table 27
Year Ended December 31
(Dollars in millions) 2014 2013
VAR (1-day holding period):
Ending $1 $3
High 38
Low 12
Average 24
Stressed VAR (10-day holding period):
Ending $41 $29
High 83 92
Low 18 11
Average 43 27
(Dollars in millions) December 31,
2014 December 31,
2013
VAR by Risk Factor (1-day holding period):
Equity risk $1 $2
Interest rate risk 12
Credit spread risk 12
VAR total (1-day diversified) 1 3
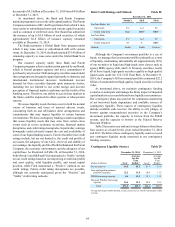
The trading portfolio, measured in terms of VAR, is
predominantly comprised of four material sub-portfolios of
covered positions: Credit Trading, Fixed Income Securities,
Interest Rate Derivatives, and Equity Derivatives. While there
were no material changes in composition of the trading portfolio
during 2014, there was a reduction in average daily VAR during
2014 compared to 2013. This was driven primarily by lower
levels of volatility as well as some risk reducing activities in the
trading portfolio. Daily VAR decreased to $1 million at
December 31, 2014 compared to $3 million at December 31,
2013. The trading portfolio of covered positions did not contain
any correlation trading positions or on- or off-balance sheet
securitization positions during 2014.
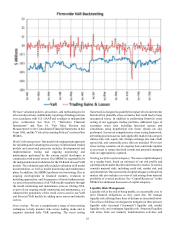
In accordance with the Market Risk Rule, we evaluate the
accuracy of our VAR model through daily backtesting by
comparing daily trading gains and losses (excluding fees,
commissions, reserves, net interest income, and intraday trading)
with the corresponding daily VAR-based measures. As
illustrated below for the year ended December 31, 2014, there
was one instance in the fourth quarter where trading losses
exceeded firmwide VAR which created a backtest exception.
This was primarily driven by the widening of credit spreads in
the corporate debt markets. The actual number of backtesting
exceptions over the preceding 12 months is used to determine
the multiplication factor for the VAR-based capital requirement
under the Market Risk Rule, whereby the capital multiplication
factor increases from a minimum of three to a maximum of four,
depending on the number of exceptions. This exception did not
result in an increase in the capital multiplication factor.