SunTrust 2014 Annual Report Download - page 70
Download and view the complete annual report
Please find page 70 of the 2014 SunTrust annual report below. You can navigate through the pages in the report by either clicking on the pages listed below, or by using the keyword search tool below to find specific information within the annual report.-
 1
1 -
2
-
3
-
4
-
5
-
6
-
7
-
8
-
9
-
10
-
11
-
12
-
13
-
14
-
15
-
16
-
17
-
18
-
19
-
20
-
21
-
22
-
23
-
24
-
25
-
26
-
27
-
28
-
29
-
30
-
31
-
32
-
33
-
34
-
35
-
36
-
37
-
38
-
39
-
40
-
41
-
42
-
43
-
44
-
45
-
46
-
47
-
48
-
49
-
50
-
51
-
52
-
53
-
54
-
55
-
56
-
57
-
58
-
59
-
 60
60 -
 61
61 -
 62
62 -
 63
63 -
 64
64 -
 65
65 -
 66
66 -
 67
67 -
 68
68 -
 69
69 -
 70
70 -
 71
71 -
 72
72 -
 73
73 -
 74
74 -
 75
75 -
 76
76 -
 77
77 -
 78
78 -
 79
79 -
 80
80 -
81
-
82
-
83
-
84
-
85
-
86
-
87
-
88
-
89
-
90
-
91
-
92
-
93
-
94
-
95
-
96
-
97
-
98
-
99
-
100
-
101
-
102
-
103
-
104
-
105
-
106
-
107
-
108
-
109
-
110
-
111
-
112
-
113
-
114
-
115
-
116
-
117
-
118
-
119
-
120
-
121
-
122
-
123
-
124
-
125
-
126
-
127
-
128
-
129
-
130
-
131
-
132
-
133
-
134
-
135
-
136
-
137
-
138
-
139
-
140
-
141
-
142
-
143
-
144
-
145
-
146
-
147
-
148
-
149
-
150
-
151
-
152
-
153
-
154
-
155
-
156
-
157
-
158
-
159
-
160
-
161
-
162
-
163
-
164
-
165
-
166
-
167
-
168
-
169
-
170
-
171
-
172
-
173
-
174
-
175
-
176
-
177
-
178
-
179
-
180
-
181
-
182
-
183
-
184
-
185
-
186
-
187
-
188
-
189
-
190
-
191
-
192
-
193
-
194
-
195
-
196
-
197
-
198
-
199
 |
 |

47
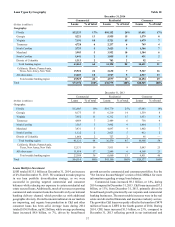
balance liquidity against investment returns. Over the longer
term, the size and composition of the investment portfolio will
reflect balance sheet trends, our overall liquidity position, and
interest rate risk management objectives. Accordingly, the size
and composition of the investment portfolio could change over
time.
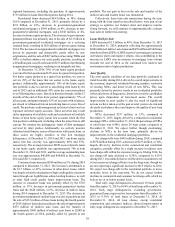
Federal Home Loan Bank and Federal Reserve Bank Stock
We acquire capital stock in the FHLB of Atlanta as a precondition
for becoming a member of that institution. This enables us to
take advantage of competitively priced advances as a wholesale
funding source and to access grants and low-cost loans for
affordable housing and community development projects,
amongst other benefits. At December 31, 2014, we held a total
of $376 million of capital stock in the FHLB, an increase of $40
million compared to December 31, 2013. During the year ended
December 31, 2014, we recognized dividends related to FHLB
capital stock of $13 million, compared to $8 million during the
year ended December 31, 2013.
Similarly, to become a member of the Federal Reserve
System, regulations require that we hold a certain amount of
capital stock, determined as either a percentage of the Bank’s
capital or as a percentage of total deposit liabilities. At
December 31, 2014, we held $402 million of Federal Reserve
Bank of Atlanta stock, unchanged from December 31, 2013.
During the year ended December 31, 2014 and 2013, we
recognized dividends related to Federal Reserve Bank of Atlanta
stock of $24 million for both periods.
Investment in The Coca-Cola Company
Prior to September 2012, we owned common shares of The Coca-
Cola Company since 1919. These shares grew in value and were
classified as securities AFS with unrealized gains, net of tax,
recorded as a component of shareholders' equity. Because of the
low accounting cost basis of these shares, we accumulated
significant unrealized gains in shareholders' equity.
In September 2012, we divested our ownership of The Coca-
Cola Company shares through sales in the market, sales to the
counterparty under certain Agreements, and a charitable
contribution of shares. As a result of The Coca-Cola Company
stock sales, charitable contribution, and termination of the
Agreements, we recorded a pre-tax gain of approximately $1.9
billion during the year ended December 31, 2012. The execution
and termination of the Agreements is discussed further in Note
17, "Derivative Financial Instruments," to the Consolidated
Financial Statements in this Form 10-K.
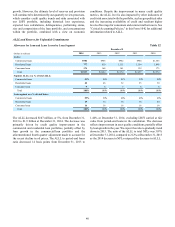
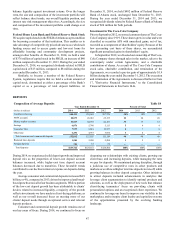
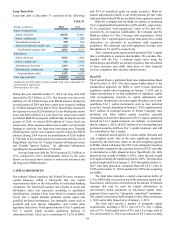
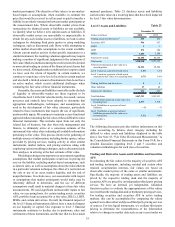
DEPOSITS
Composition of Average Deposits Table 18
Year Ended December 31 Percent of Total
(Dollars in millions) 2014 2013 2012 2014 2013 2012
Noninterest-bearing $40,411 $38,643 $37,329 30% 30% 29%
NOW accounts 28,879 26,083 25,155 22 20 20
Money market accounts 44,813 42,655 42,101 33 33 33
Savings 6,076 5,740 5,113 54 4
Consumer time 7,539 9,018 10,597 67 8
Other time 4,294 4,937 5,954 34 4
Total consumer and commercial deposits 132,012 127,076 126,249 99 98 98
Brokered time deposits 1,584 2,030 2,204 12 2
Foreign deposits 146 35 51 —— —
Total deposits $133,742 $129,141 $128,504 100% 100% 100%
During 2014, we experienced solid deposit growth and improved
deposit mix as the proportion of lower-cost deposit account
balances increased, while higher-cost time deposit account
balances decreased due to maturities. These favorable trends
contributed to our decline in interest expense on deposits during
the year.
Average consumer and commercial deposits increased $4.9
billion, or 4%, compared to 2013, driven by improved and broad-
based growth across all of our business segments. While a portion
of the low-cost deposit growth has been attributable to clients’
desires related to increased liquidity, a majority of the growth
reflects investments we have made in client-facing platforms, as
well as our overall increased focus on meeting more of our
clients' deposit needs through exceptional service and relevant
deposit products.
Consumer and commercial deposit growth remains one of
our key areas of focus. During 2014, we continued to focus on
deepening our relationships with existing clients, growing our
client base, and increasing deposits, while managing the rates
we pay for deposits. We maintained pricing discipline, through
a judicious use of competitive rates in select products and
markets as we allowed higher rate time deposits to run-off, while
growing balances in other deposit categories. Other initiatives
to attract deposits included advancements in analytics that
leverage client segmentation to identify optimal products and
solutions, as well as the deployment of new tools that enhance
client-facing teammates’ focus on providing clients with
personalized options and an exceptional client experience. We
continued to leverage our brand to improve our visibility in the
marketplace and to inspire client loyalty and capitalize on some
of the opportunities presented by the evolving banking
landscape.