SunTrust 2014 Annual Report Download - page 64
Download and view the complete annual report
Please find page 64 of the 2014 SunTrust annual report below. You can navigate through the pages in the report by either clicking on the pages listed below, or by using the keyword search tool below to find specific information within the annual report.-
 1
1 -
2
-
3
-
4
-
5
-
6
-
7
-
8
-
9
-
10
-
11
-
12
-
13
-
14
-
15
-
16
-
17
-
18
-
19
-
20
-
21
-
22
-
23
-
24
-
25
-
26
-
27
-
28
-
29
-
30
-
31
-
32
-
33
-
34
-
35
-
36
-
37
-
38
-
39
-
40
-
41
-
42
-
43
-
44
-
45
-
46
-
47
-
48
-
49
-
50
-
51
-
52
-
53
-
 54
54 -
 55
55 -
 56
56 -
 57
57 -
 58
58 -
 59
59 -
 60
60 -
 61
61 -
 62
62 -
 63
63 -
 64
64 -
 65
65 -
 66
66 -
 67
67 -
 68
68 -
 69
69 -
 70
70 -
 71
71 -
 72
72 -
 73
73 -
 74
74 -
75
-
76
-
77
-
78
-
79
-
80
-
81
-
82
-
83
-
84
-
85
-
86
-
87
-
88
-
89
-
90
-
91
-
92
-
93
-
94
-
95
-
96
-
97
-
98
-
99
-
100
-
101
-
102
-
103
-
104
-
105
-
106
-
107
-
108
-
109
-
110
-
111
-
112
-
113
-
114
-
115
-
116
-
117
-
118
-
119
-
120
-
121
-
122
-
123
-
124
-
125
-
126
-
127
-
128
-
129
-
130
-
131
-
132
-
133
-
134
-
135
-
136
-
137
-
138
-
139
-
140
-
141
-
142
-
143
-
144
-
145
-
146
-
147
-
148
-
149
-
150
-
151
-
152
-
153
-
154
-
155
-
156
-
157
-
158
-
159
-
160
-
161
-
162
-
163
-
164
-
165
-
166
-
167
-
168
-
169
-
170
-
171
-
172
-
173
-
174
-
175
-
176
-
177
-
178
-
179
-
180
-
181
-
182
-
183
-
184
-
185
-
186
-
187
-
188
-
189
-
190
-
191
-
192
-
193
-
194
-
195
-
196
-
197
-
198
-
199
 |
 |

41
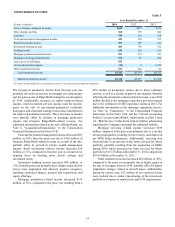
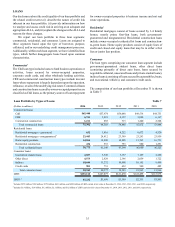
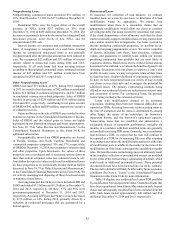
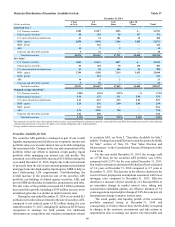
NONPERFORMING ASSETS
The following table presents our NPAs at December 31:
Table 13
(Dollars in millions) 2014 2013 2012 2011 2010
Nonaccrual/NPLs:
Commercial loans:
C&I $151 $196 $194 $348 $584
CRE 21 39 66 288 342
Commercial construction 112 34 290 961
Total commercial NPLs 173 247 294 926 1,887
Residential loans:
Residential mortgages - nonguaranteed 254 441 775 1,392 1,543
Home equity products 174 210 341 338 355
Residential construction 27 61 112 220 290
Total residential NPLs 455 712 1,228 1,950 2,188
Consumer loans:
Other direct 65 6 7 10
Indirect —7 19 20 25
Total consumer NPLs 612 25 27 35
Total nonaccrual/NPLs 634 971 1,547 2,903 4,110
OREO 199 170 264 479 596
Other repossessed assets 97 9 10 52
Nonperforming LHFS 38 17 37 — —
Total NPAs $780 $1,165 $1,857 $3,392 $4,758
Accruing loans past due 90 days or more $1,057 $1,228 $782 $2,028 $1,565
Accruing LHFS past due 90 days or more 1— 1 3 2
TDRs:
Accruing restructured loans $2,592 $2,749 $2,501 $2,820 $2,613
Nonaccruing restructured loans 2273 391 639 802 1,005
Ratios:
NPLs to period-end loans 0.48% 0.76% 1.27% 2.37% 3.54%
NPAs to period-end loans, OREO, other repossessed assets, and
nonperforming LHFS 0.59 0.91 1.52 2.76 4.08
1 Does not include foreclosed real estate related to loans insured by the FHA or the VA. Proceeds due from the FHA and the VA are recorded as a receivable in other assets until the funds
are received and the property is conveyed. The receivable amount related to proceeds due from FHA or the VA totaled $57 million, $88 million, $140 million, $132 million, and $195
million at December 31, 2014, 2013, 2012, 2011, and 2010, respectively.
2 Nonaccruing restructured loans are included in total nonaccrual/NPLs.
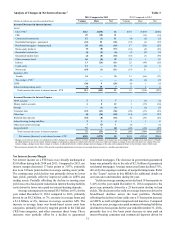
NPAs decreased $385 million, or 33%, during 2014 compared
to 2013. The decrease was primarily attributable to a $337
million, or 35%, decrease in NPLs, and a $71 million, or 42%
decline in OREO. All nonaccrual loan classes declined except
other consumer direct loans, which remained relatively
unchanged compared to 2013. Lower net charge-offs and
foreclosures, together with improved loan performance and NPL
sales, contributed to the decrease in NPLs. At December 31,
2014, our ratio of NPLs to total loans was 0.48%, down from
0.76% at December 31, 2013, reflecting the decrease in NPLs
and the increase in total loans. We expect further, moderating
decreases in NPLs during 2015, led by continuing improvements
in residential housing market conditions.
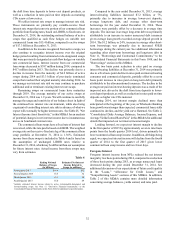
Residential real estate related loans comprise a significant
portion of our overall NPAs as a result of the devaluation of U.S.
housing during the last economic recession. The amount of time
necessary to obtain control of residential real estate collateral in
certain states, primarily Florida, has remained elevated due to
delays in the foreclosure process. These delays may continue to
impact the resolution of real estate related loans within the NPA
portfolio.
Nonaccrual loans, loans over 90 days past due and still
accruing, and TDR loans, are problem loans or loans with
potential weaknesses that are disclosed in the NPA table
above. Loans with known potential credit problems that may not
otherwise be disclosed in this table include accruing criticized
commercial loans, which are disclosed along with additional
credit quality information in Note 6, “Loans,” to the
Consolidated Financial Statements in this Form 10-K. At
December 31, 2014 and December 31, 2013, there were no
known significant potential problem loans that are not otherwise
disclosed.