SunTrust 2014 Annual Report Download - page 69
Download and view the complete annual report
Please find page 69 of the 2014 SunTrust annual report below. You can navigate through the pages in the report by either clicking on the pages listed below, or by using the keyword search tool below to find specific information within the annual report.-
 1
1 -
2
-
3
-
4
-
5
-
6
-
7
-
8
-
9
-
10
-
11
-
12
-
13
-
14
-
15
-
16
-
17
-
18
-
19
-
20
-
21
-
22
-
23
-
24
-
25
-
26
-
27
-
28
-
29
-
30
-
31
-
32
-
33
-
34
-
35
-
36
-
37
-
38
-
39
-
40
-
41
-
42
-
43
-
44
-
45
-
46
-
47
-
48
-
49
-
50
-
51
-
52
-
53
-
54
-
55
-
56
-
57
-
58
-
 59
59 -
 60
60 -
 61
61 -
 62
62 -
 63
63 -
 64
64 -
 65
65 -
 66
66 -
 67
67 -
 68
68 -
 69
69 -
 70
70 -
 71
71 -
 72
72 -
 73
73 -
 74
74 -
 75
75 -
 76
76 -
 77
77 -
 78
78 -
 79
79 -
80
-
81
-
82
-
83
-
84
-
85
-
86
-
87
-
88
-
89
-
90
-
91
-
92
-
93
-
94
-
95
-
96
-
97
-
98
-
99
-
100
-
101
-
102
-
103
-
104
-
105
-
106
-
107
-
108
-
109
-
110
-
111
-
112
-
113
-
114
-
115
-
116
-
117
-
118
-
119
-
120
-
121
-
122
-
123
-
124
-
125
-
126
-
127
-
128
-
129
-
130
-
131
-
132
-
133
-
134
-
135
-
136
-
137
-
138
-
139
-
140
-
141
-
142
-
143
-
144
-
145
-
146
-
147
-
148
-
149
-
150
-
151
-
152
-
153
-
154
-
155
-
156
-
157
-
158
-
159
-
160
-
161
-
162
-
163
-
164
-
165
-
166
-
167
-
168
-
169
-
170
-
171
-
172
-
173
-
174
-
175
-
176
-
177
-
178
-
179
-
180
-
181
-
182
-
183
-
184
-
185
-
186
-
187
-
188
-
189
-
190
-
191
-
192
-
193
-
194
-
195
-
196
-
197
-
198
-
199
 |
 |
46
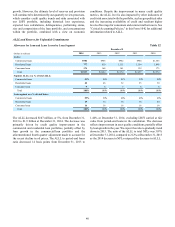
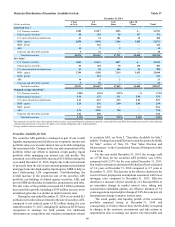
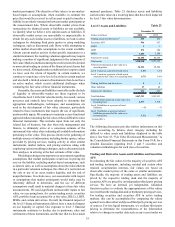
Maturity Distribution of Securities Available for Sale Table 17
December 31, 2014
(Dollars in millions) 1 Year
or Less 1-5
Years 5-10
Years After 10
Years Total
Amortized Cost 1:
U.S. Treasury securities $200 $1,217 $496 $— $1,913
Federal agency securities 64 234 36 137 471
U.S. states and political subdivisions 43 34 101 22 200
MBS - agency 2,550 8,992 7,106 3,925 22,573
MBS - private — 122 — — 122
ABS 14 3 2 — 19
Corporate and other debt securities 5 33 — — 38
Total debt securities $2,876 $10,635 $7,741 $4,084 $25,336
Fair Value 1:
U.S. Treasury securities $203 $1,221 $497 $— $1,921
Federal agency securities 64 244 38 138 484
U.S. states and political subdivisions 43 36 106 24 209
MBS - agency 2,704 9,202 7,219 3,923 23,048
MBS - private — 123 — — 123
ABS 14 5 2 — 21
Corporate and other debt securities 5 36 — — 41
Total debt securities $3,033 $10,867 $7,862 $4,085 $25,847
Weighted average yield (FTE) 2:
U.S. Treasury securities 1.98% 1.59% 1.99% —% 1.73%
Federal agency securities 4.38 3.32 3.11 2.86 3.31
U.S. states and political subdivisions 6.41 6.19 4.93 5.89 5.57
MBS - agency 2.26 2.36 2.80 2.88 2.58
MBS - private — 9.64 — — 9.64
ABS 0.76 39.38 7.28 — 7.99
Corporate and other debt securities 1.42 4.00 — — 3.66
Total debt securities 2.34% 2.40% 2.78% 2.90% 2.59%
1 The amortized cost and fair value of investments in debt securities are presented based on estimated average life. Actual cash flows may differ from estimated average lives and contractual
maturities because borrowers may have the right to call or prepay obligations with or without penalties.
2 Average yields are based on amortized cost.
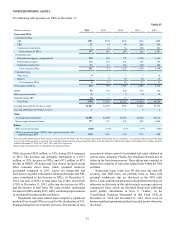
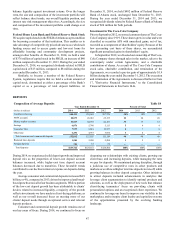
Securities Available for Sale
The securities AFS portfolio is managed as part of our overall
liquidity management and ALM process to optimize income and
portfolio value over an entire interest rate cycle while mitigating
the associated risks. Changes in the size and composition of the
portfolio reflect our efforts to maintain a high quality, liquid
portfolio while managing our interest rate risk profile. The
amortized cost of the portfolio increased $3.6 billion during the
year ended December 31, 2014, largely due to the reinvestment
of proceeds from the sale of government-guaranteed residential
mortgage loans into high-quality, liquid agency MBS to help us
meet forthcoming LCR requirements. Notwithstanding the
overall increase in the amortized cost of the securities AFS
portfolio, our holdings of federal agency securities, ABS, and
private MBS declined due to maturities, prepayments, and sales.
The fair value of the portfolio increased $4.2 billion primarily
due to portfolio growth, including a $593 million increase in net
unrealized gains due to a decline in market interest rates.
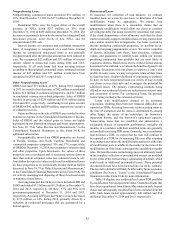
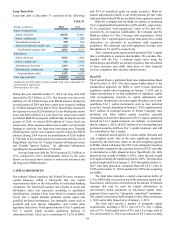
During the year ended December 31, 2014, we recorded $15
million in net realized losses related to the sale of securities AFS,
compared to net realized gains of $2 million during the year
ended December 31, 2013, including $1 million in OTTI losses
recognized in earnings for both periods. For additional
information on composition and valuation assumptions related
to securities AFS, see Note 5, "Securities Available for Sale,"
and the “Trading Assets and Derivatives and Securities Available
for Sale” section of Note 18, “Fair Value Election and
Measurement,” to the Consolidated Financial Statements in this
Form 10-K.
For the year ended December 31, 2014, the average yield
on a FTE basis for the securities AFS portfolio was 2.56%,
compared with 2.57% for the year ended December 31, 2013.
Our total investment securities portfolio had an effective duration
of 3.6 years at December 31, 2014 compared to 4.7 years at
December 31, 2013. The decrease in the effective duration is the
result of faster prepayment assumptions associated with lower
mortgage rates compared to December 31, 2013. Effective
duration is a measure of price sensitivity of a bond portfolio to
an immediate change in market interest rates, taking into
consideration embedded options. An effective duration of 3.6
years suggests an expected price change of 3.6% for a one percent
instantaneous change in market interest rates.
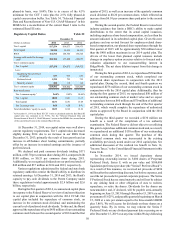
The credit quality and liquidity profile of the securities
portfolio remained strong at December 31, 2014 and
consequently, we believe that we have the flexibility to respond
to changes in the economic environment and take actions as
opportunities arise to manage our interest rate risk profile and