Sallie Mae 2008 Annual Report Download - page 99
Download and view the complete annual report
Please find page 99 of the 2008 Sallie Mae annual report below. You can navigate through the pages in the report by either clicking on the pages listed below, or by using the keyword search tool below to find specific information within the annual report.-
 1
1 -
2
-
3
-
4
-
5
-
6
-
7
-
8
-
9
-
10
-
11
-
12
-
13
-
14
-
15
-
16
-
17
-
18
-
19
-
20
-
21
-
22
-
23
-
24
-
25
-
26
-
27
-
28
-
29
-
30
-
31
-
32
-
33
-
34
-
35
-
36
-
37
-
38
-
39
-
40
-
41
-
42
-
43
-
44
-
45
-
46
-
47
-
48
-
49
-
50
-
51
-
52
-
53
-
54
-
55
-
56
-
57
-
58
-
59
-
60
-
61
-
62
-
63
-
64
-
65
-
66
-
67
-
68
-
69
-
70
-
71
-
72
-
73
-
74
-
75
-
76
-
77
-
78
-
79
-
80
-
81
-
82
-
83
-
84
-
85
-
86
-
87
-
88
-
 89
89 -
 90
90 -
 91
91 -
 92
92 -
 93
93 -
 94
94 -
 95
95 -
 96
96 -
 97
97 -
 98
98 -
 99
99 -
 100
100 -
 101
101 -
 102
102 -
 103
103 -
 104
104 -
 105
105 -
 106
106 -
 107
107 -
 108
108 -
 109
109 -
110
-
111
-
112
-
113
-
114
-
115
-
116
-
117
-
118
-
119
-
120
-
121
-
122
-
123
-
124
-
125
-
126
-
127
-
128
-
129
-
130
-
131
-
132
-
133
-
134
-
135
-
136
-
137
-
138
-
139
-
140
-
141
-
142
-
143
-
144
-
145
-
146
-
147
-
148
-
149
-
150
-
151
-
152
-
153
-
154
-
155
-
156
-
157
-
158
-
159
-
160
-
161
-
162
-
163
-
164
-
165
-
166
-
167
-
168
-
169
-
170
-
171
-
172
-
173
-
174
-
175
-
176
-
177
-
178
-
179
-
180
-
181
-
182
-
183
-
184
-
185
-
186
-
187
-
188
-
189
-
190
-
191
-
192
-
193
-
194
-
195
-
196
-
197
-
198
-
199
-
200
-
201
-
202
-
203
-
204
-
205
-
206
-
207
-
208
-
209
-
210
-
211
-
212
-
213
-
214
-
215
-
216
-
217
-
218
-
219
-
220
-
221
-
222
-
223
-
224
-
225
-
226
-
227
-
228
-
229
-
230
-
231
-
232
-
233
-
234
-
235
-
236
-
237
-
238
-
239
-
240
 |
 |

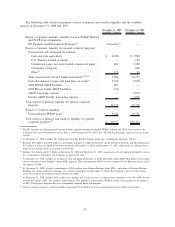
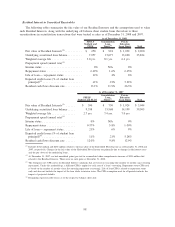
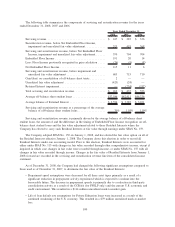
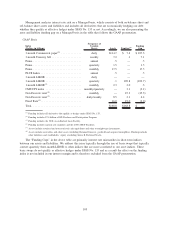
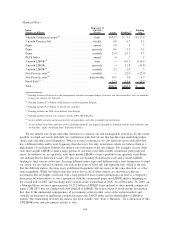
Residual Interest in Securitized Receivables
The following tables summarize the fair value of our Residual Interests and the assumptions used to value
such Residual Interests, along with the underlying off-balance sheet student loans that relate to those
securitizations in securitization transactions that were treated as sales as of December 31, 2008 and 2007.
FFELP
Stafford and
PLUS
Consolidation
Loan
Trusts
(1)
Private
Education
Loan Trusts Total
As of December 31, 2008
Fair value of Residual Interests
(2)
........... $ 250 $ 918 $ 1,032 $ 2,200
Underlying securitized loan balance ......... 7,057 15,077 13,690 35,824
Weighted average life ................... 3.0yrs. 8.1 yrs. 6.4 yrs
Prepayment speed (annual rate)
(3)
Interim status ......................... 0% N/A 0%
Repayment status ...................... 2-19% 1-6% 2-15%
Life of loan — repayment status ........... 12% 4% 6%
Expected credit losses (% of student loan
principal)
(4)
......................... .11% .23% 5.22%
Residual cash flows discount rate ........... 13.1% 11.9% 26.3%
FFELP
Stafford and PLUS
Consolidation
Loan
Trusts
(1)
Private
Education
Loan Trusts Total
As of December 31, 2007
Fair value of Residual Interests
(2)
...... $ 390 $ 730 $ 1,924 $ 3,044
Underlying securitized loan balance ..... 9,338 15,968 14,199 39,505
Weighted average life ............... 2.7yrs. 7.4 yrs. 7.0 yrs
Prepayment speed (annual rate)
(3)
Interim status ..................... 0% N/A 0%
Repayment status .................. 0-37% 3-8% 1-30%
Life of loan — repayment status ....... 21% 6% 9%
Expected credit losses (% of student loan
principal)
(4)
..................... .11% .21% 5.28%
Residual cash flows discount rate ...... 12.0% 9.8% 12.9%
(1)
Includes $762 million and $283 million related to the fair value of the Embedded Floor Income as of December 31, 2008 and
2007, respectively. Changes in the fair value of the Embedded Floor Income are primarily due to changes in the interest rates
and the pay down of the underlying loans.
(2)
At December 31, 2007, we had unrealized gains (pre-tax) in accumulated other comprehensive income of $301 million that
related to the Residual Interests. There were no such gains at December 31, 2008.
(3)
The Company uses CPR curves for Residual Interest valuations that are based on seasoning (the number of months since entering
repayment). Under this methodology, a different CPR is applied to each year of a loan’s seasoning. Repayment status CPR used
is based on the number of months since first entering repayment (seasoning). Life of loan CPR is related to repayment status
only and does not include the impact of the loan while in interim status. The CPR assumption used for all periods includes the
impact of projected defaults.
(4)
Remaining expected credit losses as of the respective balance sheet date.
98