Sallie Mae 2008 Annual Report Download - page 87
Download and view the complete annual report
Please find page 87 of the 2008 Sallie Mae annual report below. You can navigate through the pages in the report by either clicking on the pages listed below, or by using the keyword search tool below to find specific information within the annual report.-
 1
1 -
2
-
3
-
4
-
5
-
6
-
7
-
8
-
9
-
10
-
11
-
12
-
13
-
14
-
15
-
16
-
17
-
18
-
19
-
20
-
21
-
22
-
23
-
24
-
25
-
26
-
27
-
28
-
29
-
30
-
31
-
32
-
33
-
34
-
35
-
36
-
37
-
38
-
39
-
40
-
41
-
42
-
43
-
44
-
45
-
46
-
47
-
48
-
49
-
50
-
51
-
52
-
53
-
54
-
55
-
56
-
57
-
58
-
59
-
60
-
61
-
62
-
63
-
64
-
65
-
66
-
67
-
68
-
69
-
70
-
71
-
72
-
73
-
74
-
75
-
76
-
 77
77 -
 78
78 -
 79
79 -
 80
80 -
 81
81 -
 82
82 -
 83
83 -
 84
84 -
 85
85 -
 86
86 -
 87
87 -
 88
88 -
 89
89 -
 90
90 -
 91
91 -
 92
92 -
 93
93 -
 94
94 -
 95
95 -
 96
96 -
 97
97 -
98
-
99
-
100
-
101
-
102
-
103
-
104
-
105
-
106
-
107
-
108
-
109
-
110
-
111
-
112
-
113
-
114
-
115
-
116
-
117
-
118
-
119
-
120
-
121
-
122
-
123
-
124
-
125
-
126
-
127
-
128
-
129
-
130
-
131
-
132
-
133
-
134
-
135
-
136
-
137
-
138
-
139
-
140
-
141
-
142
-
143
-
144
-
145
-
146
-
147
-
148
-
149
-
150
-
151
-
152
-
153
-
154
-
155
-
156
-
157
-
158
-
159
-
160
-
161
-
162
-
163
-
164
-
165
-
166
-
167
-
168
-
169
-
170
-
171
-
172
-
173
-
174
-
175
-
176
-
177
-
178
-
179
-
180
-
181
-
182
-
183
-
184
-
185
-
186
-
187
-
188
-
189
-
190
-
191
-
192
-
193
-
194
-
195
-
196
-
197
-
198
-
199
-
200
-
201
-
202
-
203
-
204
-
205
-
206
-
207
-
208
-
209
-
210
-
211
-
212
-
213
-
214
-
215
-
216
-
217
-
218
-
219
-
220
-
221
-
222
-
223
-
224
-
225
-
226
-
227
-
228
-
229
-
230
-
231
-
232
-
233
-
234
-
235
-
236
-
237
-
238
-
239
-
240
 |
 |

CORPORATE AND OTHER BUSINESS SEGMENT
Our Corporate and Other reportable segment reflects the aggregate activity of our smaller operating units
including our Guarantor Servicing and Loan Servicing operating units, Upromise (acquired in August 2006),
other products and services, as well as corporate expenses that do not pertain directly to our operating
segments.
In our Guarantor Servicing operating unit, we provide a full complement of administrative services to
FFELP guarantors, including guarantee issuance, processing, account maintenance and guarantee fulfillment.
In our Loan Servicing operating unit, we originate and service student loans on behalf of lenders who are
unrelated to SLM Corporation. In our Upromise operating unit, we provide 529 college-savings plan program
management, transfer and servicing agent, and administration services and operate a consumer savings
network.
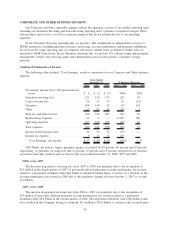
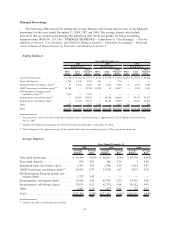
Condensed Statements of Income
The following tables include “Core Earnings” results of operations for our Corporate and Other business
segment.
2008 2007 2006 2008 vs. 2007 2007 vs. 2006
Years Ended
December 31, % Increase (Decrease)
Net interest income (loss) after provisions for
losses ............................. $ 6 $ (1) $ (5) 700% 80%
Guarantor servicing fees ................. 121 156 132 (22) 18
Loan servicing fees..................... 26 23 29 13 (21)
Upromise ............................ 108 110 42 (2) 162
Other ............................... 65 85 84 (24) 1
Total fee and other income ............... 320 374 287 (14) 30
Restructuring expenses .................. 23 2 — 1,050 100
Operating expenses ..................... 277 339 250 (18) 36
Total expenses ........................ 300 341 250 (12) 36
Income before income taxes .............. 26 32 32 (19) —
Income tax expense .................... 9 12 12 (25) —
“Core Earnings” net income ............ $ 17 $ 20 $ 20 (15)% —%
USA Funds, the nation’s largest guarantee agency, accounted for 85 percent, 86 percent and 83 percent,
respectively, of guarantor servicing fees and 11 percent, 16 percent and 25 percent, respectively, of revenues
associated with other products and services for the years ended December 31, 2008, 2007 and 2006.
2008 versus 2007
The decrease in guarantor servicing fees from 2007 to 2008 was primarily due to the recognition of
$15 million in the fourth quarter of 2007 of previously deferred guarantee account maintenance fee revenue
related to a negotiated settlement with USA Funds as discussed further below, as well as to a decrease in the
account maintenance fees earned in 2008 due to the legislative changes effective October 1, 2007 as a result
of CCRAA.
2007 versus 2006
The increase in guarantor servicing fees from 2006 to 2007 was primarily due to the recognition of
$15 million of previously deferred guarantee account maintenance fee revenue related to a negotiated
settlement with USA Funds in the second quarter of 2006. The negotiated settlement with USA Funds would
have resulted in the Company having to return the $15 million to USA Funds, if certain events occurred prior
86