Sallie Mae 2008 Annual Report Download - page 190
Download and view the complete annual report
Please find page 190 of the 2008 Sallie Mae annual report below. You can navigate through the pages in the report by either clicking on the pages listed below, or by using the keyword search tool below to find specific information within the annual report.-
 1
1 -
2
-
3
-
4
-
5
-
6
-
7
-
8
-
9
-
10
-
11
-
12
-
13
-
14
-
15
-
16
-
17
-
18
-
19
-
20
-
21
-
22
-
23
-
24
-
25
-
26
-
27
-
28
-
29
-
30
-
31
-
32
-
33
-
34
-
35
-
36
-
37
-
38
-
39
-
40
-
41
-
42
-
43
-
44
-
45
-
46
-
47
-
48
-
49
-
50
-
51
-
52
-
53
-
54
-
55
-
56
-
57
-
58
-
59
-
60
-
61
-
62
-
63
-
64
-
65
-
66
-
67
-
68
-
69
-
70
-
71
-
72
-
73
-
74
-
75
-
76
-
77
-
78
-
79
-
80
-
81
-
82
-
83
-
84
-
85
-
86
-
87
-
88
-
89
-
90
-
91
-
92
-
93
-
94
-
95
-
96
-
97
-
98
-
99
-
100
-
101
-
102
-
103
-
104
-
105
-
106
-
107
-
108
-
109
-
110
-
111
-
112
-
113
-
114
-
115
-
116
-
117
-
118
-
119
-
120
-
121
-
122
-
123
-
124
-
125
-
126
-
127
-
128
-
129
-
130
-
131
-
132
-
133
-
134
-
135
-
136
-
137
-
138
-
139
-
140
-
141
-
142
-
143
-
144
-
145
-
146
-
147
-
148
-
149
-
150
-
151
-
152
-
153
-
154
-
155
-
156
-
157
-
158
-
159
-
160
-
161
-
162
-
163
-
164
-
165
-
166
-
167
-
168
-
169
-
170
-
171
-
172
-
173
-
174
-
175
-
176
-
177
-
178
-
179
-
 180
180 -
 181
181 -
 182
182 -
 183
183 -
 184
184 -
 185
185 -
 186
186 -
 187
187 -
 188
188 -
 189
189 -
 190
190 -
 191
191 -
 192
192 -
 193
193 -
 194
194 -
 195
195 -
 196
196 -
 197
197 -
 198
198 -
 199
199 -
 200
200 -
201
-
202
-
203
-
204
-
205
-
206
-
207
-
208
-
209
-
210
-
211
-
212
-
213
-
214
-
215
-
216
-
217
-
218
-
219
-
220
-
221
-
222
-
223
-
224
-
225
-
226
-
227
-
228
-
229
-
230
-
231
-
232
-
233
-
234
-
235
-
236
-
237
-
238
-
239
-
240
 |
 |

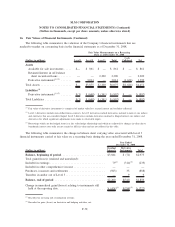
13. Stock-Based Compensation Plans and Arrangements (Continued)
Non-vested restricted stock granted prior to January 25, 2007 is entitled to dividend credits; non-vested
restricted stock granted on or after January 25, 2007 is not.
In accordance with SFAS No. 123(R), the fair value of restricted stock awards is estimated on the date of
grant based on the market price of the stock and is amortized to compensation cost on a straight-line basis
over the related vesting periods. As of December 31, 2008, there was $6 million of unrecognized compensa-
tion cost related to restricted stock, which is expected to be recognized over a weighted average period of
1.4 years.
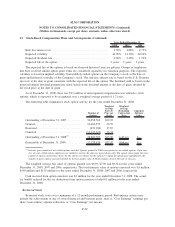
The following table summarizes restricted stock activity for the year ended December 31, 2008.
Number of
Shares
Weighted
Average Grant
Date
Fair Value
Non-vested at December 31, 2007 ............................. 419,151 $48.02
Granted ................................................. 639,500 20.39
Vested .................................................. (234,689) 44.92
Canceled ................................................ (69,416) 32.54
Non-vested at December 31, 2008 ............................. 754,546 $26.99
The total fair value of shares that vested during the years ended December 31, 2008, 2007 and 2006, was
$11 million, $8 million and $3 million, respectively.
Restricted Stock Units
Restricted stock units (“RSUs”) are credits based on the value of the Company’s common stock. The fair
value of each grant is estimated on the date of grant based on the market price of the stock and is amortized
to compensation cost on a straight-line basis over the related vesting periods. All outstanding RSUs granted to
executive management employees vested in 2007 and were converted to common stock in January 2008.
In 2008, the Company began granting RSUs to non-executive management employees with the same
performance vesting criteria as restricted stock. As of December 31, 2008, there was $.1 million of
unrecognized compensation cost related to RSUs, which is expected to be recognized over a weighted average
period of 1.7 years.
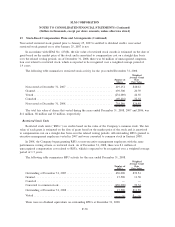
The following table summarizes RSU activity for the year ended December 31, 2008.
Number of
RSUs
Weighted
Average Grant
Date
Fair Value
Outstanding at December 31, 2007 ............................. 650,000 $39.54
Granted ................................................. 15,500 11.58
Canceled ................................................ — —
Converted to common stock .................................. (650,000) 39.54
Outstanding at December 31, 2008 ............................. 15,500 $11.58
Vested .................................................. — $ —
There were no dividend equivalents on outstanding RSUs at December 31, 2008.
F-70
SLM CORPORATION
NOTES TO CONSOLIDATED FINANCIAL STATEMENTS (Continued)
(Dollars in thousands, except per share amounts, unless otherwise stated)