Sallie Mae 2008 Annual Report Download - page 39
Download and view the complete annual report
Please find page 39 of the 2008 Sallie Mae annual report below. You can navigate through the pages in the report by either clicking on the pages listed below, or by using the keyword search tool below to find specific information within the annual report.-
 1
1 -
2
-
3
-
4
-
5
-
6
-
7
-
8
-
9
-
10
-
11
-
12
-
13
-
14
-
15
-
16
-
17
-
18
-
19
-
20
-
21
-
22
-
23
-
24
-
25
-
26
-
27
-
28
-
 29
29 -
 30
30 -
 31
31 -
 32
32 -
 33
33 -
 34
34 -
 35
35 -
 36
36 -
 37
37 -
 38
38 -
 39
39 -
 40
40 -
 41
41 -
 42
42 -
 43
43 -
 44
44 -
 45
45 -
 46
46 -
 47
47 -
 48
48 -
 49
49 -
50
-
51
-
52
-
53
-
54
-
55
-
56
-
57
-
58
-
59
-
60
-
61
-
62
-
63
-
64
-
65
-
66
-
67
-
68
-
69
-
70
-
71
-
72
-
73
-
74
-
75
-
76
-
77
-
78
-
79
-
80
-
81
-
82
-
83
-
84
-
85
-
86
-
87
-
88
-
89
-
90
-
91
-
92
-
93
-
94
-
95
-
96
-
97
-
98
-
99
-
100
-
101
-
102
-
103
-
104
-
105
-
106
-
107
-
108
-
109
-
110
-
111
-
112
-
113
-
114
-
115
-
116
-
117
-
118
-
119
-
120
-
121
-
122
-
123
-
124
-
125
-
126
-
127
-
128
-
129
-
130
-
131
-
132
-
133
-
134
-
135
-
136
-
137
-
138
-
139
-
140
-
141
-
142
-
143
-
144
-
145
-
146
-
147
-
148
-
149
-
150
-
151
-
152
-
153
-
154
-
155
-
156
-
157
-
158
-
159
-
160
-
161
-
162
-
163
-
164
-
165
-
166
-
167
-
168
-
169
-
170
-
171
-
172
-
173
-
174
-
175
-
176
-
177
-
178
-
179
-
180
-
181
-
182
-
183
-
184
-
185
-
186
-
187
-
188
-
189
-
190
-
191
-
192
-
193
-
194
-
195
-
196
-
197
-
198
-
199
-
200
-
201
-
202
-
203
-
204
-
205
-
206
-
207
-
208
-
209
-
210
-
211
-
212
-
213
-
214
-
215
-
216
-
217
-
218
-
219
-
220
-
221
-
222
-
223
-
224
-
225
-
226
-
227
-
228
-
229
-
230
-
231
-
232
-
233
-
234
-
235
-
236
-
237
-
238
-
239
-
240
 |
 |
operating segments that do not meet such thresholds and are aggregated in the Corporate and Other reportable
segment for financial reporting purposes.
The management reporting process measures the performance of the Company’s operating segments based
on the management structure of the Company as well as the methodology used by management to evaluate
performance and allocate resources. In accordance with the Rules and Regulations of the Securities and
Exchange Commission (“SEC”), we prepare financial statements in accordance with GAAP. In addition to
evaluating the Company’s GAAP-based financial information, management, including the Company’s chief
operation decision maker, evaluates the performance of the Company’s operating segments based on their
profitability on a basis that, as allowed under SFAS No. 131, differs from GAAP. We refer to management’s
basis of evaluating our segment results as “Core Earnings” presentations for each business segment and we
refer to these performance measures in our presentations with credit rating agencies and lenders. Accordingly,
information regarding the Company’s reportable segments is provided herein based on “Core Earnings,” which
are discussed in detail below.
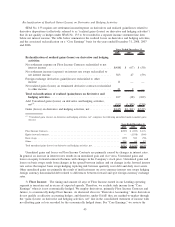
Our “Core Earnings” are not defined terms within GAAP and may not be comparable to similarly titled
measures reported by other companies. “Core Earnings” net income reflects only current period adjustments to
GAAP net income as described below. Unlike financial accounting, there is no comprehensive, authoritative
guidance for management reporting and as a result, our management reporting is not necessarily comparable
with similar information for any other financial institution. The Company’s operating segments are defined by
the products and services they offer or the types of customers they serve, and they reflect the manner in which
financial information is currently evaluated by management. Intersegment revenues and expenses are netted
within the appropriate financial statement line items consistent with the income statement presentation
provided to management. Changes in management structure or allocation methodologies and procedures may
result in changes in reported segment financial information.
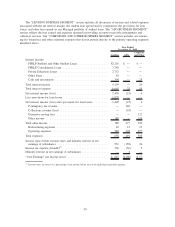
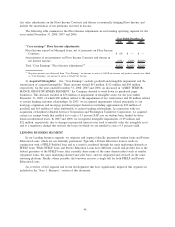
“Core Earnings” are the primary financial performance measures used by management to develop the
Company’s financial plans, track results, and establish corporate performance targets and incentive compensa-
tion. While “Core Earnings” are not a substitute for reported results under GAAP, the Company relies on
“Core Earnings” in operating its business because “Core Earnings” permit management to make meaningful
period-to-period comparisons of the operational and performance indicators that are most closely assessed by
management. Management believes this information provides additional insight into the financial performance
of the core business activities of our operating segments. Accordingly, the tables presented below reflect “Core
Earnings” which is reviewed and utilized by management to manage the business for each of the Company’s
reportable segments. A further discussion regarding “Core Earnings” is included under “Limitations of ‘Core
Earnings’” and “Pre-tax Differences between ‘Core Earnings’ and GAAP by Business Segment.”
38