Sallie Mae 2008 Annual Report Download - page 24
Download and view the complete annual report
Please find page 24 of the 2008 Sallie Mae annual report below. You can navigate through the pages in the report by either clicking on the pages listed below, or by using the keyword search tool below to find specific information within the annual report.-
 1
1 -
2
-
3
-
4
-
5
-
6
-
7
-
8
-
9
-
10
-
11
-
12
-
13
-
 14
14 -
 15
15 -
 16
16 -
 17
17 -
 18
18 -
 19
19 -
 20
20 -
 21
21 -
 22
22 -
 23
23 -
 24
24 -
 25
25 -
 26
26 -
 27
27 -
 28
28 -
 29
29 -
 30
30 -
 31
31 -
 32
32 -
 33
33 -
 34
34 -
35
-
36
-
37
-
38
-
39
-
40
-
41
-
42
-
43
-
44
-
45
-
46
-
47
-
48
-
49
-
50
-
51
-
52
-
53
-
54
-
55
-
56
-
57
-
58
-
59
-
60
-
61
-
62
-
63
-
64
-
65
-
66
-
67
-
68
-
69
-
70
-
71
-
72
-
73
-
74
-
75
-
76
-
77
-
78
-
79
-
80
-
81
-
82
-
83
-
84
-
85
-
86
-
87
-
88
-
89
-
90
-
91
-
92
-
93
-
94
-
95
-
96
-
97
-
98
-
99
-
100
-
101
-
102
-
103
-
104
-
105
-
106
-
107
-
108
-
109
-
110
-
111
-
112
-
113
-
114
-
115
-
116
-
117
-
118
-
119
-
120
-
121
-
122
-
123
-
124
-
125
-
126
-
127
-
128
-
129
-
130
-
131
-
132
-
133
-
134
-
135
-
136
-
137
-
138
-
139
-
140
-
141
-
142
-
143
-
144
-
145
-
146
-
147
-
148
-
149
-
150
-
151
-
152
-
153
-
154
-
155
-
156
-
157
-
158
-
159
-
160
-
161
-
162
-
163
-
164
-
165
-
166
-
167
-
168
-
169
-
170
-
171
-
172
-
173
-
174
-
175
-
176
-
177
-
178
-
179
-
180
-
181
-
182
-
183
-
184
-
185
-
186
-
187
-
188
-
189
-
190
-
191
-
192
-
193
-
194
-
195
-
196
-
197
-
198
-
199
-
200
-
201
-
202
-
203
-
204
-
205
-
206
-
207
-
208
-
209
-
210
-
211
-
212
-
213
-
214
-
215
-
216
-
217
-
218
-
219
-
220
-
221
-
222
-
223
-
224
-
225
-
226
-
227
-
228
-
229
-
230
-
231
-
232
-
233
-
234
-
235
-
236
-
237
-
238
-
239
-
240
 |
 |

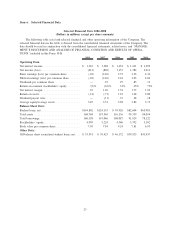
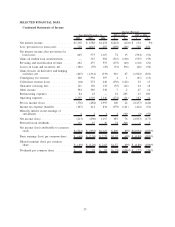
Item 6. Selected Financial Data
Selected Financial Data 2004-2008
(Dollars in millions, except per share amounts)
The following table sets forth selected financial and other operating information of the Company. The
selected financial data in the table is derived from the consolidated financial statements of the Company. The
data should be read in conjunction with the consolidated financial statements, related notes, and “MANAGE-
MENT’S DISCUSSION AND ANALYSIS OF FINANCIAL CONDITION AND RESULTS OF OPERA-
TIONS” included in this Form 10-K.
2008 2007 2006 2005 2004
Operating Data:
Net interest income ....................... $ 1,365 $ 1,588 $ 1,454 $ 1,451 $ 1,299
Net income (loss) ......................... (213) (896) 1,157 1,382 1,914
Basic earnings (loss) per common share ........ (.69) (2.26) 2.73 3.25 4.36
Diluted earnings (loss) per common share ....... (.69) (2.26) 2.63 3.05 4.04
Dividends per common share ................ — .25 .97 .85 .74
Return on common stockholders’ equity ........ (9)% (22)% 32% 45% 73%
Net interest margin........................ .93 1.26 1.54 1.77 1.92
Return on assets .......................... (.14) (.71) 1.22 1.68 2.80
Dividend payout ratio ...................... — (11) 37 28 18
Average equity/average assets ................ 3.45 3.51 3.98 3.82 3.73
Balance Sheet Data:
Student loans, net......................... $144,802 $124,153 $ 95,920 $82,604 $65,981
Total assets ............................. 168,768 155,565 116,136 99,339 84,094
Total borrowings ......................... 160,158 147,046 108,087 91,929 78,122
Stockholders’ equity....................... 4,999 5,224 4,360 3,792 3,102
Book value per common share ............... 7.03 7.84 9.24 7.81 6.93
Other Data:
Off-balance sheet securitized student loans, net . . . $ 35,591 $ 39,423 $ 46,172 $39,925 $41,457
23