Sallie Mae 2008 Annual Report Download - page 54
Download and view the complete annual report
Please find page 54 of the 2008 Sallie Mae annual report below. You can navigate through the pages in the report by either clicking on the pages listed below, or by using the keyword search tool below to find specific information within the annual report.-
 1
1 -
2
-
3
-
4
-
5
-
6
-
7
-
8
-
9
-
10
-
11
-
12
-
13
-
14
-
15
-
16
-
17
-
18
-
19
-
20
-
21
-
22
-
23
-
24
-
25
-
26
-
27
-
28
-
29
-
30
-
31
-
32
-
33
-
34
-
35
-
36
-
37
-
38
-
39
-
40
-
41
-
42
-
43
-
 44
44 -
 45
45 -
 46
46 -
 47
47 -
 48
48 -
 49
49 -
 50
50 -
 51
51 -
 52
52 -
 53
53 -
 54
54 -
 55
55 -
 56
56 -
 57
57 -
 58
58 -
 59
59 -
 60
60 -
 61
61 -
 62
62 -
 63
63 -
 64
64 -
65
-
66
-
67
-
68
-
69
-
70
-
71
-
72
-
73
-
74
-
75
-
76
-
77
-
78
-
79
-
80
-
81
-
82
-
83
-
84
-
85
-
86
-
87
-
88
-
89
-
90
-
91
-
92
-
93
-
94
-
95
-
96
-
97
-
98
-
99
-
100
-
101
-
102
-
103
-
104
-
105
-
106
-
107
-
108
-
109
-
110
-
111
-
112
-
113
-
114
-
115
-
116
-
117
-
118
-
119
-
120
-
121
-
122
-
123
-
124
-
125
-
126
-
127
-
128
-
129
-
130
-
131
-
132
-
133
-
134
-
135
-
136
-
137
-
138
-
139
-
140
-
141
-
142
-
143
-
144
-
145
-
146
-
147
-
148
-
149
-
150
-
151
-
152
-
153
-
154
-
155
-
156
-
157
-
158
-
159
-
160
-
161
-
162
-
163
-
164
-
165
-
166
-
167
-
168
-
169
-
170
-
171
-
172
-
173
-
174
-
175
-
176
-
177
-
178
-
179
-
180
-
181
-
182
-
183
-
184
-
185
-
186
-
187
-
188
-
189
-
190
-
191
-
192
-
193
-
194
-
195
-
196
-
197
-
198
-
199
-
200
-
201
-
202
-
203
-
204
-
205
-
206
-
207
-
208
-
209
-
210
-
211
-
212
-
213
-
214
-
215
-
216
-
217
-
218
-
219
-
220
-
221
-
222
-
223
-
224
-
225
-
226
-
227
-
228
-
229
-
230
-
231
-
232
-
233
-
234
-
235
-
236
-
237
-
238
-
239
-
240
 |
 |
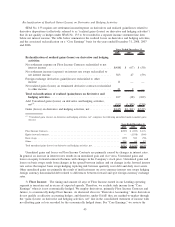
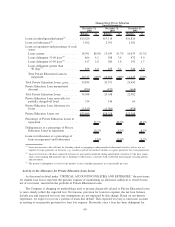
status-based migration analysis used for the allowance for Private Education Loans. We use this estimate to
offset accrued interest in the current period through a charge to student loan interest income. As our provision
for loan losses increased significantly in 2007 compared to 2006, we had a similar rise in the estimate of
uncollectible accrued interest receivable. The Company also experienced a higher cost of funds in 2007
primarily due to the disruption in the credit markets, as previously discussed.
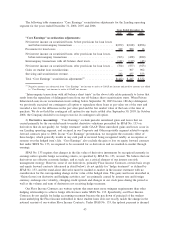
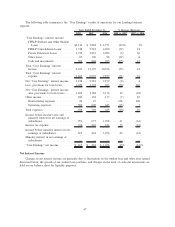
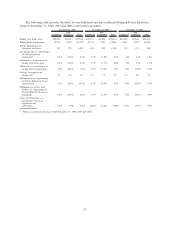
The “Core Earnings” basis FFELP loan spread for 2008 declined from 2007 and 2006 primarily as a
result of the increase in the cost of funds previously discussed, as well as the mix of the FFELP portfolio
shifting towards loans originated subsequent to October 1, 2007 which have lower yields as a result of the
CCRAA. The “Core Earnings” basis Private Education Loan spread before provision for loan losses for 2008
was relatively consistent with 2007 and 2006. The changes in the “Core Earnings” basis Private Education
Loan spread after provision for loan losses for all periods presented was primarily due to the timing and
amount of provision associated with our allowance for Private Education Loan Losses as discussed below (see
“Private Education Loan Losses — Activity in the Allowance for Private Education Loan Losses”).
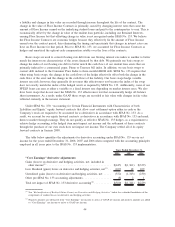
“Core Earnings” Basis Other Asset Spread
The “Core Earnings” basis other asset spread is generated from cash and investments (both restricted and
unrestricted) primarily in our liquidity portfolio, and other loans. The Company invests its liquidity portfolio
primarily in short-term securities with maturities of one week or less in order to manage counterparty credit
risk and maintain available cash balances. The “Core Earnings” basis other asset spread for 2008 decreased
40 basis points from 2007. The 2007 spread decreased by 41 basis points from 2006. Changes in this spread
primarily relate to differences between the index basis and reset frequency of the asset indices and funding
indices. In volatile interest rate environments, the asset and debt reset frequencies will lag each other. Changes
in this spread are also a result of the increase in our cost of funds as previously discussed.
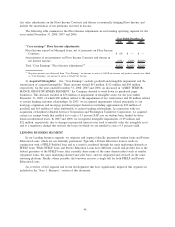
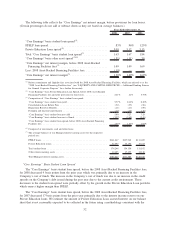
“Core Earnings” Net Interest Margin
The “Core Earnings” net interest margin, before 2008 Asset-Backed Financing Facilities fees, for 2008
was unchanged from the prior year and decreased 20 basis points from 2006 to 2007. The increase in the
Managed student loan portfolio as a percentage of the overall Managed interest-earning asset portfolio from
2007 to 2008 resulted in an increase to “Core Earnings” net interest margin of 6 basis points due to the
Managed student loan portfolio earning a higher spread than the Managed other interest-earning asset
portfolio. This was offset by a decrease of 6 basis points primarily due to the previously discussed changes in
the student loan and other asset spreads. The student loan portfolio as a percentage of the overall interest
earning asset portfolio did not change substantially from 2006 to 2007. The decrease in spread from 2006 to
2007 primarily related to the previously discussed changes in the on-balance sheet student loan and other asset
spreads.
The 2008 Asset-Backed Financing Facilities closed on February 29, 2008. Amortization of the upfront
commitment and liquidity fees began on that date.
53