Sallie Mae 2008 Annual Report Download - page 58
Download and view the complete annual report
Please find page 58 of the 2008 Sallie Mae annual report below. You can navigate through the pages in the report by either clicking on the pages listed below, or by using the keyword search tool below to find specific information within the annual report.-
 1
1 -
2
-
3
-
4
-
5
-
6
-
7
-
8
-
9
-
10
-
11
-
12
-
13
-
14
-
15
-
16
-
17
-
18
-
19
-
20
-
21
-
22
-
23
-
24
-
25
-
26
-
27
-
28
-
29
-
30
-
31
-
32
-
33
-
34
-
35
-
36
-
37
-
38
-
39
-
40
-
41
-
42
-
43
-
44
-
45
-
46
-
47
-
 48
48 -
 49
49 -
 50
50 -
 51
51 -
 52
52 -
 53
53 -
 54
54 -
 55
55 -
 56
56 -
 57
57 -
 58
58 -
 59
59 -
 60
60 -
 61
61 -
 62
62 -
 63
63 -
 64
64 -
 65
65 -
 66
66 -
 67
67 -
 68
68 -
69
-
70
-
71
-
72
-
73
-
74
-
75
-
76
-
77
-
78
-
79
-
80
-
81
-
82
-
83
-
84
-
85
-
86
-
87
-
88
-
89
-
90
-
91
-
92
-
93
-
94
-
95
-
96
-
97
-
98
-
99
-
100
-
101
-
102
-
103
-
104
-
105
-
106
-
107
-
108
-
109
-
110
-
111
-
112
-
113
-
114
-
115
-
116
-
117
-
118
-
119
-
120
-
121
-
122
-
123
-
124
-
125
-
126
-
127
-
128
-
129
-
130
-
131
-
132
-
133
-
134
-
135
-
136
-
137
-
138
-
139
-
140
-
141
-
142
-
143
-
144
-
145
-
146
-
147
-
148
-
149
-
150
-
151
-
152
-
153
-
154
-
155
-
156
-
157
-
158
-
159
-
160
-
161
-
162
-
163
-
164
-
165
-
166
-
167
-
168
-
169
-
170
-
171
-
172
-
173
-
174
-
175
-
176
-
177
-
178
-
179
-
180
-
181
-
182
-
183
-
184
-
185
-
186
-
187
-
188
-
189
-
190
-
191
-
192
-
193
-
194
-
195
-
196
-
197
-
198
-
199
-
200
-
201
-
202
-
203
-
204
-
205
-
206
-
207
-
208
-
209
-
210
-
211
-
212
-
213
-
214
-
215
-
216
-
217
-
218
-
219
-
220
-
221
-
222
-
223
-
224
-
225
-
226
-
227
-
228
-
229
-
230
-
231
-
232
-
233
-
234
-
235
-
236
-
237
-
238
-
239
-
240
 |
 |

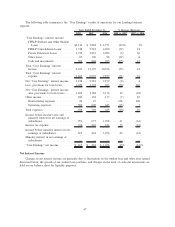
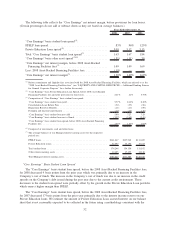
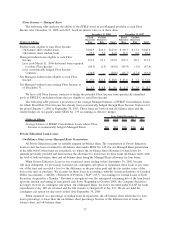
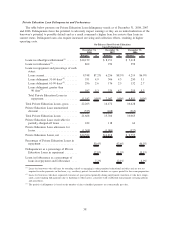
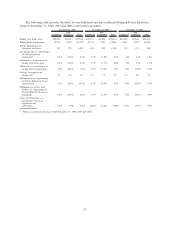
Floor Income — Managed Basis
The following table analyzes the ability of the FFELP loans in our Managed portfolio to earn Floor
Income after December 31, 2008 and 2007, based on interest rates as of those dates.
(Dollars in billions)
Fixed
Borrower
Rate
Variable
Borrower
Rate Total
Fixed
Borrower
Rate
Variable
Borrower
Rate Total
December 31, 2008 December 31, 2007
Student loans eligible to earn Floor Income:
On-balance sheet student loans ................ $104.9 $16.1 $121.0 $ 89.3 $ 17.1 $106.4
Off-balance sheet student loans ............... 15.0 7.0 22.0 15.9 9.2 25.1
Managed student loans eligible to earn Floor
Income ................................. 119.9 23.1 143.0 105.2 26.3 131.5
Less: post-March 31, 2006 disbursed loans required
to rebate Floor Income .................... (64.3) (1.3) (65.6) (45.9) (1.5) (47.4)
Less: economically hedged Floor Income
Contracts .............................. (28.6) — (28.6) (15.7) (17.4) (33.1)
Net Managed student loans eligible to earn Floor
Income ................................. $ 27.0 $21.8 $ 48.8 $ 43.6 $ 7.4 $ 51.0
Net Managed student loans earning Floor Income as
of December 31, .......................... $ 4.3 $ 4.8 $ 9.1 $ 1.3 $ 7.4 $ 8.7
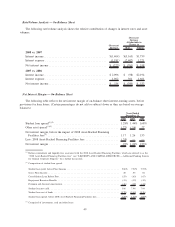
We have sold Floor Income contracts to hedge the potential Floor Income from specifically identified
pools of FFELP Consolidation loans that are eligible to earn Floor Income.
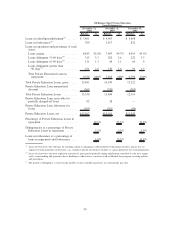
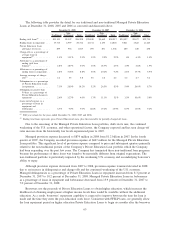
The following table presents a projection of the average Managed balance of FFELP Consolidation Loans
for which Fixed Rate Floor Income has already been economically hedged through Floor Income Contracts for
the period January 1, 2009 to September 30, 2013. These loans are both on and off-balance sheet and the
related hedges do not qualify under SFAS No. 133 accounting as effective hedges.
(Dollars in billions) 2009 2010 2011 2012 2013
Years Ended December 31,
Average balance of FFELP Consolidation Loans whose Floor
Income is economically hedged (Managed Basis) .......... $21 $19 $16 $16 $4
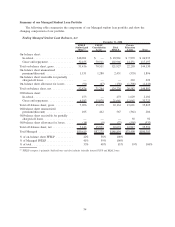
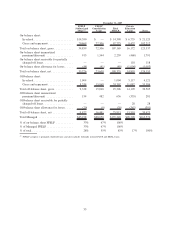
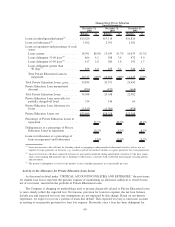
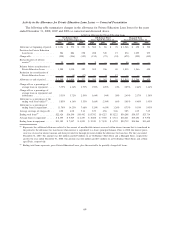
Private Education Loan Losses
On-Balance Sheet versus Managed Basis Presentation
All Private Education Loans are initially acquired on-balance sheet. The securitization of Private Education
Loans to date has been accounted for off-balance sheet under SFAS No. 140. For our Managed Basis presentation
in the table below, when loans are securitized, we reduce the on-balance sheet allowance for loan losses for
amounts previously provided and then increase the allowance for loan losses for these loans off-balance sheet, with
the total of both on-balance sheet and off-balance sheet being the Managed Basis allowance for loan losses.
When Private Education Loans in our securitized trusts settling before September 30, 2005, became
180 days delinquent, we previously exercised our contingent call option to repurchase these loans at par value
out of the trust and recorded a loss for the difference in the par value paid and the fair market value of the
loan at the time of purchase. We account for these loans in accordance with the American Institute of Certified
Public Accountants’ (“AICPA”) Statement of Position (“SOP”) 03-3, “Accounting for Certain Loans or Debt
Securities Acquired in a Transfer.” Revenue is recognized over the anticipated remaining life of the loan based
upon the amount and timing of anticipated cash flows. Beginning in October 2008, the Company decided to
no longer exercise its contingent call option. On a Managed Basis, the losses recorded under GAAP for loans
repurchased at day 180 are reversed and the full amount is charged-off at day 212. We do not hold the
contingent call option for any trusts settled after September 30, 2005.
When measured as a percentage of ending loans in repayment, the off-balance sheet allowance for loan
losses percentage is lower than the on-balance sheet percentage because of the different mix of loans on-
balance sheet and off-balance sheet.
57