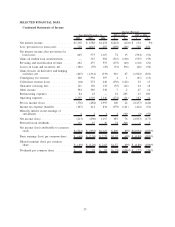
Sallie Mae 2008 Annual Report Download - page 32
Download and view the complete annual report
Please find page 32 of the 2008 Sallie Mae annual report below. You can navigate through the pages in the report by either clicking on the pages listed below, or by using the keyword search tool below to find specific information within the annual report.-
 1
1 -
2
-
3
-
4
-
5
-
6
-
7
-
8
-
9
-
10
-
11
-
12
-
13
-
14
-
15
-
16
-
17
-
18
-
19
-
20
-
21
-
 22
22 -
 23
23 -
 24
24 -
 25
25 -
 26
26 -
 27
27 -
 28
28 -
 29
29 -
 30
30 -
 31
31 -
 32
32 -
 33
33 -
 34
34 -
 35
35 -
 36
36 -
 37
37 -
 38
38 -
 39
39 -
 40
40 -
 41
41 -
 42
42 -
43
-
44
-
45
-
46
-
47
-
48
-
49
-
50
-
51
-
52
-
53
-
54
-
55
-
56
-
57
-
58
-
59
-
60
-
61
-
62
-
63
-
64
-
65
-
66
-
67
-
68
-
69
-
70
-
71
-
72
-
73
-
74
-
75
-
76
-
77
-
78
-
79
-
80
-
81
-
82
-
83
-
84
-
85
-
86
-
87
-
88
-
89
-
90
-
91
-
92
-
93
-
94
-
95
-
96
-
97
-
98
-
99
-
100
-
101
-
102
-
103
-
104
-
105
-
106
-
107
-
108
-
109
-
110
-
111
-
112
-
113
-
114
-
115
-
116
-
117
-
118
-
119
-
120
-
121
-
122
-
123
-
124
-
125
-
126
-
127
-
128
-
129
-
130
-
131
-
132
-
133
-
134
-
135
-
136
-
137
-
138
-
139
-
140
-
141
-
142
-
143
-
144
-
145
-
146
-
147
-
148
-
149
-
150
-
151
-
152
-
153
-
154
-
155
-
156
-
157
-
158
-
159
-
160
-
161
-
162
-
163
-
164
-
165
-
166
-
167
-
168
-
169
-
170
-
171
-
172
-
173
-
174
-
175
-
176
-
177
-
178
-
179
-
180
-
181
-
182
-
183
-
184
-
185
-
186
-
187
-
188
-
189
-
190
-
191
-
192
-
193
-
194
-
195
-
196
-
197
-
198
-
199
-
200
-
201
-
202
-
203
-
204
-
205
-
206
-
207
-
208
-
209
-
210
-
211
-
212
-
213
-
214
-
215
-
216
-
217
-
218
-
219
-
220
-
221
-
222
-
223
-
224
-
225
-
226
-
227
-
228
-
229
-
230
-
231
-
232
-
233
-
234
-
235
-
236
-
237
-
238
-
239
-
240
 |
 |
September 30, 2008 and December 31, 2008. We use non-binding broker quotes and industry analyst
reports which show changes in the indicative prices of the asset-backed securities tranches immedi-
ately senior to the Residual Interest as an indication of potential changes in the discount rate used to
value the Residual Interest. We also use the most current prepayment and default rate assumptions to
project the expected cash flows used to value Residual Interests. These assumptions are internally
developed and primarily based on analyzing the actual results of loan performance from past periods.
See Note 8, “Student Loan Securitization,” to the consolidated financial statements for a discussion
of all assumption changes made during the quarter to properly determine the fair value of the
Residual Interests as well as a shock analysis to fair value related to all significant assumptions.
4. Student Loans — Our FFELP loans and Private Education Loans are accounted for at cost or at the
lower of cost or fair value if the loan is held-for-sale. The fair value is disclosed in compliance with
SFAS No. 107. For both FFELP loans and Private Education Loans accounted for at cost, fair value
is determined by modeling loan level cash flows using stated terms of the assets and internally-
developed assumptions to determine aggregate portfolio yield, net present value and average life. The
significant assumptions used to project cash flows are prepayment speeds, default rates, cost of funds,
and required return on equity. In addition, the Floor Income component of our FFELP loan portfolio
is valued through discounted cash flow and option models using both observable market inputs and
internally developed inputs. Significant inputs into the models are not generally market observable.
They are either derived internally through a combination of historical experience and management’s
qualitative expectation of future performance (in the case of prepayment speeds, default rates, and
capital assumptions), or are obtained through external broker quotes (as in the case of cost of funds).
When possible, market transactions are used to validate the model. In most cases these are either
infrequent or not observable. For FFELP loans classified as held-for-sale and accounted for at the
lower of cost or market, the fair value is based on the committed sales price of the various loan
purchase programs established by ED.
Securitization Accounting and Retained Interests
We regularly engage in securitization transactions as part of our Lending segment financing strategy (see
also “LIQUIDITY AND CAPITAL RESOURCES — Securitization Activities”). In a securitization, we sell
student loans to a trust that issues bonds backed by the student loans as part of the transaction. When our
securitizations meet the sale criteria of SFAS No. 140, “Accounting for Transfers and Servicing of Financial
Assets and Extinguishments of Liabilities — a Replacement of SFAS No. 125,” we record a gain on the sale
of the student loans, which is the difference between the allocated cost basis of the assets sold and the relative
fair value of the assets received including the Residual Interest component of the Retained Interest in the
securitization transaction. The Residual Interest is the right to receive cash flows from the student loans and
reserve accounts in excess of the amounts needed to pay servicing, derivative costs (if any), other fees, and the
principal and interest on the bonds backed by the student loans. We have not structured any securitization
transaction to meet the sale criteria since March 2007 and all securitizations settled since that date have been
accounted for on-balance sheet as secured financings as a result.
We adopted SFAS 159, “The Fair Value Option for Financial Assets and Financial Liabilities — Including
an Amendment of FASB Statement 115,” effective January 1, 2008, whereby we elected to carry all existing
Residual Interests at fair value with subsequent changes in fair value recorded in servicing and securitization
revenue. Since there are no quoted market prices for our Residual Interests, we estimate their fair value both
initially and each subsequent quarter using the key assumptions listed below:
• The CPR (see “Premium and Discount Amortization” above for discussion of this assumption);
• The expected credit losses from the underlying securitized loan portfolio. Although loss estimates
related to the Allowance for Loan Loss are based on a loss confirmation period of generally two years,
expected credit losses related to the Residual Interests use a life of loan default rate. The life of loan
default rate is used to determine the percentage of the loan’s original balance that will default. The life
of loan default rate is then applied using a curve to determine the percentage of the overall default rate
31