Sallie Mae 2008 Annual Report Download - page 86
Download and view the complete annual report
Please find page 86 of the 2008 Sallie Mae annual report below. You can navigate through the pages in the report by either clicking on the pages listed below, or by using the keyword search tool below to find specific information within the annual report.-
 1
1 -
2
-
3
-
4
-
5
-
6
-
7
-
8
-
9
-
10
-
11
-
12
-
13
-
14
-
15
-
16
-
17
-
18
-
19
-
20
-
21
-
22
-
23
-
24
-
25
-
26
-
27
-
28
-
29
-
30
-
31
-
32
-
33
-
34
-
35
-
36
-
37
-
38
-
39
-
40
-
41
-
42
-
43
-
44
-
45
-
46
-
47
-
48
-
49
-
50
-
51
-
52
-
53
-
54
-
55
-
56
-
57
-
58
-
59
-
60
-
61
-
62
-
63
-
64
-
65
-
66
-
67
-
68
-
69
-
70
-
71
-
72
-
73
-
74
-
75
-
 76
76 -
 77
77 -
 78
78 -
 79
79 -
 80
80 -
 81
81 -
 82
82 -
 83
83 -
 84
84 -
 85
85 -
 86
86 -
 87
87 -
 88
88 -
 89
89 -
 90
90 -
 91
91 -
 92
92 -
 93
93 -
 94
94 -
 95
95 -
 96
96 -
97
-
98
-
99
-
100
-
101
-
102
-
103
-
104
-
105
-
106
-
107
-
108
-
109
-
110
-
111
-
112
-
113
-
114
-
115
-
116
-
117
-
118
-
119
-
120
-
121
-
122
-
123
-
124
-
125
-
126
-
127
-
128
-
129
-
130
-
131
-
132
-
133
-
134
-
135
-
136
-
137
-
138
-
139
-
140
-
141
-
142
-
143
-
144
-
145
-
146
-
147
-
148
-
149
-
150
-
151
-
152
-
153
-
154
-
155
-
156
-
157
-
158
-
159
-
160
-
161
-
162
-
163
-
164
-
165
-
166
-
167
-
168
-
169
-
170
-
171
-
172
-
173
-
174
-
175
-
176
-
177
-
178
-
179
-
180
-
181
-
182
-
183
-
184
-
185
-
186
-
187
-
188
-
189
-
190
-
191
-
192
-
193
-
194
-
195
-
196
-
197
-
198
-
199
-
200
-
201
-
202
-
203
-
204
-
205
-
206
-
207
-
208
-
209
-
210
-
211
-
212
-
213
-
214
-
215
-
216
-
217
-
218
-
219
-
220
-
221
-
222
-
223
-
224
-
225
-
226
-
227
-
228
-
229
-
230
-
231
-
232
-
233
-
234
-
235
-
236
-
237
-
238
-
239
-
240
 |
 |

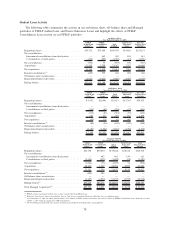
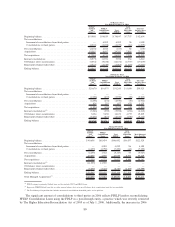
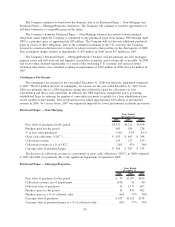
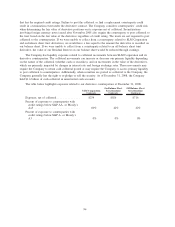
The carrying value of purchased paper (the basis we carry on our balance sheet) as a percentage of
collateral fair value has decreased in 2008 as a result of the significant impairment recognized during the year.
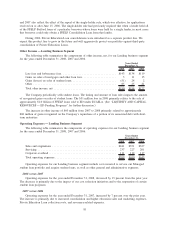
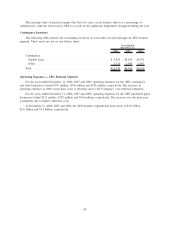
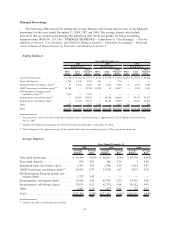
Contingency Inventory
The following table presents the outstanding inventory of receivables serviced through our APG business
segment. These assets are not on our balance sheet.
2008 2007 2006
Years Ended
December 31,
Contingency:
Student loans......................................... $ 9,852 $8,195 $6,971
Other .............................................. 1,726 1,509 1,667
Total ................................................. $11,578 $9,704 $8,638
Operating Expenses — APG Business Segment
For the years ended December 31, 2008, 2007 and 2006, operating expenses for the APG contingency
and other businesses totaled $167 million, $196 million and $194 million, respectively. The decrease in
operating expenses in 2008 versus prior years is primarily due to the Company’s cost reduction initiatives.
For the years ended December 31, 2008, 2007 and 2006, operating expenses for the APG purchased paper
businesses totaled $231 million, $192 million and $164 million, respectively. The increase over the prior year
is primarily due to higher collection costs.
At December 31, 2008, 2007 and 2006, the APG business segment had total assets of $2.0 billion,
$2.6 billion and $1.5 billion, respectively.
85