Sallie Mae 2008 Annual Report Download - page 111
Download and view the complete annual report
Please find page 111 of the 2008 Sallie Mae annual report below. You can navigate through the pages in the report by either clicking on the pages listed below, or by using the keyword search tool below to find specific information within the annual report.-
 1
1 -
2
-
3
-
4
-
5
-
6
-
7
-
8
-
9
-
10
-
11
-
12
-
13
-
14
-
15
-
16
-
17
-
18
-
19
-
20
-
21
-
22
-
23
-
24
-
25
-
26
-
27
-
28
-
29
-
30
-
31
-
32
-
33
-
34
-
35
-
36
-
37
-
38
-
39
-
40
-
41
-
42
-
43
-
44
-
45
-
46
-
47
-
48
-
49
-
50
-
51
-
52
-
53
-
54
-
55
-
56
-
57
-
58
-
59
-
60
-
61
-
62
-
63
-
64
-
65
-
66
-
67
-
68
-
69
-
70
-
71
-
72
-
73
-
74
-
75
-
76
-
77
-
78
-
79
-
80
-
81
-
82
-
83
-
84
-
85
-
86
-
87
-
88
-
89
-
90
-
91
-
92
-
93
-
94
-
95
-
96
-
97
-
98
-
99
-
100
-
 101
101 -
 102
102 -
 103
103 -
 104
104 -
 105
105 -
 106
106 -
 107
107 -
 108
108 -
 109
109 -
 110
110 -
 111
111 -
 112
112 -
 113
113 -
 114
114 -
 115
115 -
 116
116 -
 117
117 -
 118
118 -
 119
119 -
 120
120 -
 121
121 -
122
-
123
-
124
-
125
-
126
-
127
-
128
-
129
-
130
-
131
-
132
-
133
-
134
-
135
-
136
-
137
-
138
-
139
-
140
-
141
-
142
-
143
-
144
-
145
-
146
-
147
-
148
-
149
-
150
-
151
-
152
-
153
-
154
-
155
-
156
-
157
-
158
-
159
-
160
-
161
-
162
-
163
-
164
-
165
-
166
-
167
-
168
-
169
-
170
-
171
-
172
-
173
-
174
-
175
-
176
-
177
-
178
-
179
-
180
-
181
-
182
-
183
-
184
-
185
-
186
-
187
-
188
-
189
-
190
-
191
-
192
-
193
-
194
-
195
-
196
-
197
-
198
-
199
-
200
-
201
-
202
-
203
-
204
-
205
-
206
-
207
-
208
-
209
-
210
-
211
-
212
-
213
-
214
-
215
-
216
-
217
-
218
-
219
-
220
-
221
-
222
-
223
-
224
-
225
-
226
-
227
-
228
-
229
-
230
-
231
-
232
-
233
-
234
-
235
-
236
-
237
-
238
-
239
-
240
 |
 |

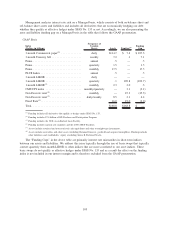
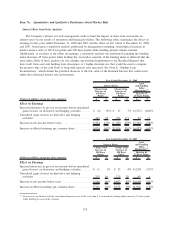
Item 7A. Quantitative and Qualitative Disclosures about Market Risk
Interest Rate Sensitivity Analysis
The Company’s interest rate risk management seeks to limit the impact of short-term movements in
interest rates on our results of operations and financial position. The following tables summarize the effect on
earnings for the years ended December 31, 2008 and 2007 and the effect on fair values at December 31, 2008
and 2007, based upon a sensitivity analysis performed by management assuming a hypothetical increase in
market interest rates of 100 basis points and 300 basis points while funding spreads remain constant.
Additionally, as it relates to the effect on earnings, a sensitivity analysis was performed assuming the funding
index increases 25 basis points while holding the asset index constant, if the funding index is different that the
asset index. Both of these analyses do not consider any potential impairment to our Residual Interests that
may result from asset and funding basis divergence or a higher discount rate that would be used to compute
the present value of the cash flows if long-term interest rates increased. See Note 8, “Student Loan
Securitization,” which details the potential decrease to the fair value of the Residual Interest that could occur
under the referenced interest rate environment.
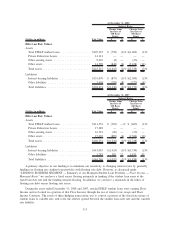
(Dollars in millions, except per share amounts) $ % $ % $ %
Increase of
25 Basis Points
Change from
Increase of
300 Basis
Points
Change from
Increase of
100 Basis
Points
Asset
and Funding
Index
Mismatches
(1)
Interest Rates:
Year Ended December 31, 2008
Effect on Earnings
Increase/(decrease) in pre-tax net income before unrealized
gains (losses) on derivative and hedging activities ...... $ (6) (3)% $ 13 7% $ (297) (162)%
Unrealized gains (losses) on derivative and hedging
activities .................................... 460 82 956 171 95 17
Increase in net income before taxes .................. $454 121% $ 969 258% $ (202) (54)%
Increase in diluted earnings per common share .......... $.974 141% $2.076 301% $(.433) (63)%
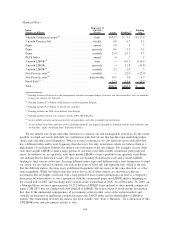
(Dollars in millions, except per share amounts) $ % $ % $ %
Change from
Increase of
100 Basis
Points
Change from
Increase of
300 Basis
Points
Increase of
25 Basis Points
Asset
and Funding
Index
Mismatches
(1)
Interest Rates:
Year Ended December 31, 2007
Effect on Earnings
Increase/(decrease) in pre-tax net income before unrealized
gains (losses) on derivative and hedging activities ...... $ 11 1% $ 32 4% $(229) (27)%
Unrealized gains (losses) on derivative and hedging
activities .................................... 213 16 375 28 80 6
Increase in net income before taxes .................. $224 46% $407 85% $(149) (31)%
Increase in diluted earnings per common share .......... $.361 16% $.674 30% $(.361) (16)%
(1)
If an asset is not funded with the same index/frequency reset of the asset then it is assumed the funding index increases 25 basis points
while holding the asset index constant.
110