Sallie Mae 2008 Annual Report Download - page 6
Download and view the complete annual report
Please find page 6 of the 2008 Sallie Mae annual report below. You can navigate through the pages in the report by either clicking on the pages listed below, or by using the keyword search tool below to find specific information within the annual report.-
 1
1 -
 2
2 -
 3
3 -
 4
4 -
 5
5 -
 6
6 -
 7
7 -
 8
8 -
 9
9 -
 10
10 -
 11
11 -
 12
12 -
 13
13 -
 14
14 -
 15
15 -
 16
16 -
 17
17 -
18
-
19
-
20
-
21
-
22
-
23
-
24
-
25
-
26
-
27
-
28
-
29
-
30
-
31
-
32
-
33
-
34
-
35
-
36
-
37
-
38
-
39
-
40
-
41
-
42
-
43
-
44
-
45
-
46
-
47
-
48
-
49
-
50
-
51
-
52
-
53
-
54
-
55
-
56
-
57
-
58
-
59
-
60
-
61
-
62
-
63
-
64
-
65
-
66
-
67
-
68
-
69
-
70
-
71
-
72
-
73
-
74
-
75
-
76
-
77
-
78
-
79
-
80
-
81
-
82
-
83
-
84
-
85
-
86
-
87
-
88
-
89
-
90
-
91
-
92
-
93
-
94
-
95
-
96
-
97
-
98
-
99
-
100
-
101
-
102
-
103
-
104
-
105
-
106
-
107
-
108
-
109
-
110
-
111
-
112
-
113
-
114
-
115
-
116
-
117
-
118
-
119
-
120
-
121
-
122
-
123
-
124
-
125
-
126
-
127
-
128
-
129
-
130
-
131
-
132
-
133
-
134
-
135
-
136
-
137
-
138
-
139
-
140
-
141
-
142
-
143
-
144
-
145
-
146
-
147
-
148
-
149
-
150
-
151
-
152
-
153
-
154
-
155
-
156
-
157
-
158
-
159
-
160
-
161
-
162
-
163
-
164
-
165
-
166
-
167
-
168
-
169
-
170
-
171
-
172
-
173
-
174
-
175
-
176
-
177
-
178
-
179
-
180
-
181
-
182
-
183
-
184
-
185
-
186
-
187
-
188
-
189
-
190
-
191
-
192
-
193
-
194
-
195
-
196
-
197
-
198
-
199
-
200
-
201
-
202
-
203
-
204
-
205
-
206
-
207
-
208
-
209
-
210
-
211
-
212
-
213
-
214
-
215
-
216
-
217
-
218
-
219
-
220
-
221
-
222
-
223
-
224
-
225
-
226
-
227
-
228
-
229
-
230
-
231
-
232
-
233
-
234
-
235
-
236
-
237
-
238
-
239
-
240
 |
 |
As discussed above, in 2008, many lenders exited the FFELP marketplace, creating concerns about the
availability of federal loans for students served by this program. As a result, some schools began to decrease
their participation in the FFELP program in July 2008 for the stability of the FDLP. ED estimated that the
FDLP could double its market share.
The Higher Education Act (the “HEA”) regulates every aspect of the federally guaranteed student loan
program, including communications with borrowers, loan originations and default aversion. Failure to service a
student loan properly could jeopardize the guarantee on federal student loans. This guarantee generally covers
98 and 97 percent of the student loan’s principal and accrued interest for loans disbursed before and after
July 1, 2006, respectively. In the case of death, disability or bankruptcy of the borrower, the guarantee covers
100 percent of the loan’s principal and accrued interest.
FFELP loans are guaranteed by state agencies or non-profit companies designated as guarantors, with ED
providing reinsurance to the guarantor. Guarantors are responsible for performing certain functions necessary
to ensure the program’s soundness and accountability. These functions include reviewing loan application data
to detect and prevent fraud and abuse and to assist lenders in preventing default by providing counseling to
borrowers. Generally, the guarantor is responsible for ensuring that loans are serviced in compliance with the
requirements of the HEA. When a borrower defaults on a FFELP loan, we submit a claim to the guarantor
who provides reimbursements of principal and accrued interest subject to the Risk Sharing (See APPENDIX A,
“FEDERAL FAMILY EDUCATION LOAN PROGRAM,” to this document for a description of the role of
guarantors.)
Private Education Loan Products
In addition to federal loan programs, which have statutory limits on annual and total borrowing, we
sponsor a variety of Private Education Loan programs to bridge the gap between the cost of education and a
student’s resources. The majority of our Private Education Loans are made in conjunction with a FFELP
Stafford loan and are marketed to schools through the same marketing channels and by the same sales force as
FFELP loans. As a result of the credit market dislocation discussed above, a large number of lenders have
exited the Private Education Loan business and only a few of the country’s largest banks continue to offer the
product. Private Education Loans are discussed in more detail below.
Drivers of Growth in the Student Loan Industry
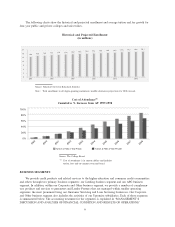
Growth in our Managed student loan portfolio is driven by the growth in the overall market for student
loans, as well as by our own market share gains. Rising enrollment and college costs have resulted in the size
of the federally insured student loan market more than doubling over the last 10 years. Federally insured
student loan originations grew from $30.0 billion in FFY 1998 to $75.5 billion in FFY 2008.
According to the College Board, tuition and fees at four-year public institutions and four-year private
institutions have increased 50 percent and 27 percent, respectively, in constant, inflation-adjusted dollars, since
AY 1998-1999. Under the FFELP, there are limits to the amount students can borrow each academic year. The
first loan limit increases since 1992 were implemented July 1, 2007. In response to the credit crisis, Congress
significantly increased loan limits again in 2008. As a result, we anticipate that students will rely more on
federal loans to fund their tuition needs. Both federal and private loans as a percentage of total student aid
were 52 percent of total student aid in AY 1997-1998 and 53 percent in AY 2007-2008. Private Education
Loans accounted for 22 percent of total student loans — both federally guaranteed and Private Education
Loans — in AY 2007-2008, compared to 7 percent in AY 1997-1998.
The National Center for Education Statistics predicts that the college-age population will increase
approximately 10 percent from 2008 to 2017. Demand for education credit is expected to increase due to this
population demographic, first-time college enrollments of older students and continuing interest in adult
education.
5