Sallie Mae 2008 Annual Report Download - page 64
Download and view the complete annual report
Please find page 64 of the 2008 Sallie Mae annual report below. You can navigate through the pages in the report by either clicking on the pages listed below, or by using the keyword search tool below to find specific information within the annual report.-
 1
1 -
2
-
3
-
4
-
5
-
6
-
7
-
8
-
9
-
10
-
11
-
12
-
13
-
14
-
15
-
16
-
17
-
18
-
19
-
20
-
21
-
22
-
23
-
24
-
25
-
26
-
27
-
28
-
29
-
30
-
31
-
32
-
33
-
34
-
35
-
36
-
37
-
38
-
39
-
40
-
41
-
42
-
43
-
44
-
45
-
46
-
47
-
48
-
49
-
50
-
51
-
52
-
53
-
 54
54 -
 55
55 -
 56
56 -
 57
57 -
 58
58 -
 59
59 -
 60
60 -
 61
61 -
 62
62 -
 63
63 -
 64
64 -
 65
65 -
 66
66 -
 67
67 -
 68
68 -
 69
69 -
 70
70 -
 71
71 -
 72
72 -
 73
73 -
 74
74 -
75
-
76
-
77
-
78
-
79
-
80
-
81
-
82
-
83
-
84
-
85
-
86
-
87
-
88
-
89
-
90
-
91
-
92
-
93
-
94
-
95
-
96
-
97
-
98
-
99
-
100
-
101
-
102
-
103
-
104
-
105
-
106
-
107
-
108
-
109
-
110
-
111
-
112
-
113
-
114
-
115
-
116
-
117
-
118
-
119
-
120
-
121
-
122
-
123
-
124
-
125
-
126
-
127
-
128
-
129
-
130
-
131
-
132
-
133
-
134
-
135
-
136
-
137
-
138
-
139
-
140
-
141
-
142
-
143
-
144
-
145
-
146
-
147
-
148
-
149
-
150
-
151
-
152
-
153
-
154
-
155
-
156
-
157
-
158
-
159
-
160
-
161
-
162
-
163
-
164
-
165
-
166
-
167
-
168
-
169
-
170
-
171
-
172
-
173
-
174
-
175
-
176
-
177
-
178
-
179
-
180
-
181
-
182
-
183
-
184
-
185
-
186
-
187
-
188
-
189
-
190
-
191
-
192
-
193
-
194
-
195
-
196
-
197
-
198
-
199
-
200
-
201
-
202
-
203
-
204
-
205
-
206
-
207
-
208
-
209
-
210
-
211
-
212
-
213
-
214
-
215
-
216
-
217
-
218
-
219
-
220
-
221
-
222
-
223
-
224
-
225
-
226
-
227
-
228
-
229
-
230
-
231
-
232
-
233
-
234
-
235
-
236
-
237
-
238
-
239
-
240
 |
 |

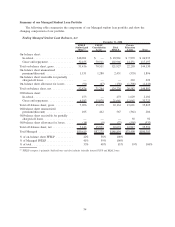
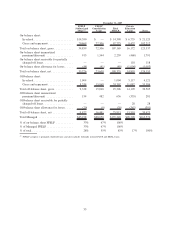
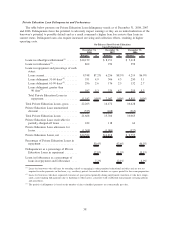
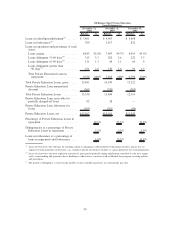
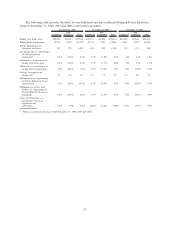
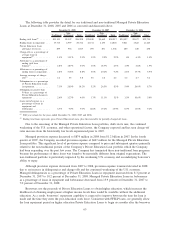
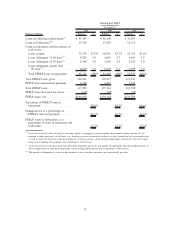
The following table provides the detail for our traditional and non-traditional Managed Private Education
Loans at December 31, 2008, 2007 and 2006 as previously presented.
Traditional
Non-
Traditional Total Traditional
Non-
Traditional Total Traditional
Non-
Traditional Total
December 31, 2008 December 31, 2007 December 31, 2006
Ending total loans, gross .... $30,949 $4,945 $35,894 $25,791 $4,580 $30,371 $20,006 $3,644 $23,650
Ending loans in repayment . . . 17,715 2,997 20,712 12,711 2,155 14,866 9,821 1,822 11,643
Private Education Loan
allowance for losses . . .... 707 792 1,499 438 782 1,220 179 215 394
Net charge-offs as a percentage
of average loans in
repayment
(1)
........... 2.1% 14.3% 3.9% 1.5% 11.9% 3.1% .6% 7.2% 1.6%
Allowance as a percentage of
ending total loans, gross . . . 2.3% 16.0% 4.2% 1.7% 17.1% 4.0% .9% 5.9% 1.7%
Allowance as a percentage of
ending loans in repayment . . 4.0% 26.4% 7.2% 3.5% 36.3% 8.2% 1.8% 11.8% 3.4%
Average coverage of net
charge-offs
(1)
.......... 2.4 2.3 2.3 2.6 3.3 3.0 3.3 2.0 2.4
Delinquencies as a percentage
of Private Education Loans
in repayment. . ......... 7.1% 28.9% 10.2% 5.2% 26.3% 8.3% 5.4% 26.0% 8.7%
Delinquencies greater than
90 days as a percentage of
Private Education Loans in
repayment . . . ......... 2.6% 12.7% 4.0% 1.7% 11.1% 3.1% 1.5% 10.6% 3.0%
Loans in forbearance as a
percentage of loans in
repayment and
forbearance . . ......... 6.7% 9.0% 7.0% 12.8% 19.4% 13.9% 8.7% 11.9% 9.2%
(1)
Full year actuals for the years ended December 31, 2008, 2007 and 2006.
63