Sallie Mae 2008 Annual Report Download - page 95
Download and view the complete annual report
Please find page 95 of the 2008 Sallie Mae annual report below. You can navigate through the pages in the report by either clicking on the pages listed below, or by using the keyword search tool below to find specific information within the annual report.-
 1
1 -
2
-
3
-
4
-
5
-
6
-
7
-
8
-
9
-
10
-
11
-
12
-
13
-
14
-
15
-
16
-
17
-
18
-
19
-
20
-
21
-
22
-
23
-
24
-
25
-
26
-
27
-
28
-
29
-
30
-
31
-
32
-
33
-
34
-
35
-
36
-
37
-
38
-
39
-
40
-
41
-
42
-
43
-
44
-
45
-
46
-
47
-
48
-
49
-
50
-
51
-
52
-
53
-
54
-
55
-
56
-
57
-
58
-
59
-
60
-
61
-
62
-
63
-
64
-
65
-
66
-
67
-
68
-
69
-
70
-
71
-
72
-
73
-
74
-
75
-
76
-
77
-
78
-
79
-
80
-
81
-
82
-
83
-
84
-
 85
85 -
 86
86 -
 87
87 -
 88
88 -
 89
89 -
 90
90 -
 91
91 -
 92
92 -
 93
93 -
 94
94 -
 95
95 -
 96
96 -
 97
97 -
 98
98 -
 99
99 -
 100
100 -
 101
101 -
 102
102 -
 103
103 -
 104
104 -
 105
105 -
106
-
107
-
108
-
109
-
110
-
111
-
112
-
113
-
114
-
115
-
116
-
117
-
118
-
119
-
120
-
121
-
122
-
123
-
124
-
125
-
126
-
127
-
128
-
129
-
130
-
131
-
132
-
133
-
134
-
135
-
136
-
137
-
138
-
139
-
140
-
141
-
142
-
143
-
144
-
145
-
146
-
147
-
148
-
149
-
150
-
151
-
152
-
153
-
154
-
155
-
156
-
157
-
158
-
159
-
160
-
161
-
162
-
163
-
164
-
165
-
166
-
167
-
168
-
169
-
170
-
171
-
172
-
173
-
174
-
175
-
176
-
177
-
178
-
179
-
180
-
181
-
182
-
183
-
184
-
185
-
186
-
187
-
188
-
189
-
190
-
191
-
192
-
193
-
194
-
195
-
196
-
197
-
198
-
199
-
200
-
201
-
202
-
203
-
204
-
205
-
206
-
207
-
208
-
209
-
210
-
211
-
212
-
213
-
214
-
215
-
216
-
217
-
218
-
219
-
220
-
221
-
222
-
223
-
224
-
225
-
226
-
227
-
228
-
229
-
230
-
231
-
232
-
233
-
234
-
235
-
236
-
237
-
238
-
239
-
240
 |
 |

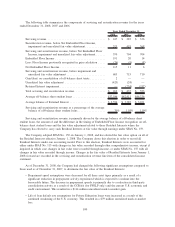
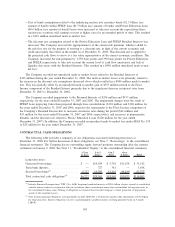
that has the required credit ratings. Failure to post the collateral or find a replacement counterparty could
result in a termination event under the derivative contract. The Company considers counterparties’ credit risk
when determining the fair value of derivative positions on its exposure net of collateral. Securitizations
involving foreign currency notes issued after November 2005 also require the counterparty to post collateral to
the trust based on the fair value of the derivative regardless of credit rating. The trusts are not required to post
collateral to the counterparties. If we were unable to collect from a counterparty related to SLM Corporation
and on-balance sheet trust derivatives, we would have a loss equal to the amount the derivative is recorded on
our balance sheet. If we were unable to collect from a counterparty related to an off-balance sheet trust
derivative, the value of our Residual Interest on our balance sheet would be reduced through earnings.
The Company has liquidity exposure related to collateral movements between SLM Corporation and its
derivative counterparties. The collateral movements can increase or decrease our primary liquidity depending
on the nature of the collateral (whether cash or securities), and on movements in the value of the derivatives,
which are primarily impacted by changes in interest rate and foreign exchange rates. These movements may
require the Company to return cash collateral posted or may require the Company to access primary liquidity
to post collateral to counterparties. Additionally, when securities are posted as collateral to the Company, the
Company generally has the right to re-pledge or sell the security. As of December 31, 2008, the Company
held $1.6 billion of cash collateral in unrestricted cash accounts.
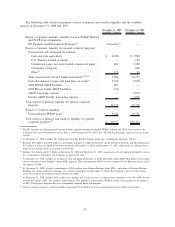
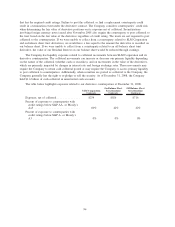
The table below highlights exposure related to our derivative counterparties at December 31, 2008.
SLM Corporation
Contracts
On-Balance Sheet
Securitizations
Contracts
Off-Balance Sheet
Securitizations
Contracts
Exposure, net of collateral . .............. $234 $926 $716
Percent of exposure to counterparties with
credit ratings below S&P AA- or Moody’s
Aa3 ............................. 60% 42% 42%
Percent of exposure to counterparties with
credit ratings below S&P A- or Moody’s
A3 .............................. 0% 0% 0%
94