Sallie Mae 2008 Annual Report Download - page 63
Download and view the complete annual report
Please find page 63 of the 2008 Sallie Mae annual report below. You can navigate through the pages in the report by either clicking on the pages listed below, or by using the keyword search tool below to find specific information within the annual report.-
 1
1 -
2
-
3
-
4
-
5
-
6
-
7
-
8
-
9
-
10
-
11
-
12
-
13
-
14
-
15
-
16
-
17
-
18
-
19
-
20
-
21
-
22
-
23
-
24
-
25
-
26
-
27
-
28
-
29
-
30
-
31
-
32
-
33
-
34
-
35
-
36
-
37
-
38
-
39
-
40
-
41
-
42
-
43
-
44
-
45
-
46
-
47
-
48
-
49
-
50
-
51
-
52
-
 53
53 -
 54
54 -
 55
55 -
 56
56 -
 57
57 -
 58
58 -
 59
59 -
 60
60 -
 61
61 -
 62
62 -
 63
63 -
 64
64 -
 65
65 -
 66
66 -
 67
67 -
 68
68 -
 69
69 -
 70
70 -
 71
71 -
 72
72 -
 73
73 -
74
-
75
-
76
-
77
-
78
-
79
-
80
-
81
-
82
-
83
-
84
-
85
-
86
-
87
-
88
-
89
-
90
-
91
-
92
-
93
-
94
-
95
-
96
-
97
-
98
-
99
-
100
-
101
-
102
-
103
-
104
-
105
-
106
-
107
-
108
-
109
-
110
-
111
-
112
-
113
-
114
-
115
-
116
-
117
-
118
-
119
-
120
-
121
-
122
-
123
-
124
-
125
-
126
-
127
-
128
-
129
-
130
-
131
-
132
-
133
-
134
-
135
-
136
-
137
-
138
-
139
-
140
-
141
-
142
-
143
-
144
-
145
-
146
-
147
-
148
-
149
-
150
-
151
-
152
-
153
-
154
-
155
-
156
-
157
-
158
-
159
-
160
-
161
-
162
-
163
-
164
-
165
-
166
-
167
-
168
-
169
-
170
-
171
-
172
-
173
-
174
-
175
-
176
-
177
-
178
-
179
-
180
-
181
-
182
-
183
-
184
-
185
-
186
-
187
-
188
-
189
-
190
-
191
-
192
-
193
-
194
-
195
-
196
-
197
-
198
-
199
-
200
-
201
-
202
-
203
-
204
-
205
-
206
-
207
-
208
-
209
-
210
-
211
-
212
-
213
-
214
-
215
-
216
-
217
-
218
-
219
-
220
-
221
-
222
-
223
-
224
-
225
-
226
-
227
-
228
-
229
-
230
-
231
-
232
-
233
-
234
-
235
-
236
-
237
-
238
-
239
-
240
 |
 |

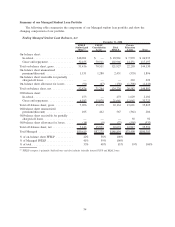
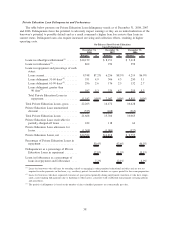
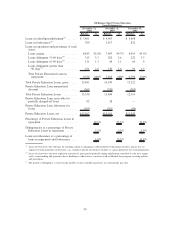
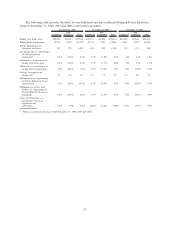
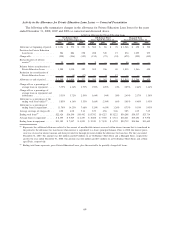
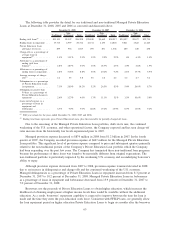
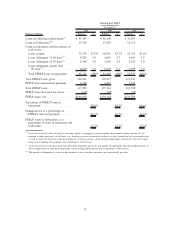
The following table summarizes changes in the allowance for Private Education Loan losses for the years
ended December 31, 2008, 2007 and 2006 as previously reported.
Activity in the Allowance for Private Education Loan Losses — Prior Presentation
2008 2007 2006 2008 2007 2006 2008 2007 2006
On-Balance Sheet
Years Ended December 31,
Off-Balance Sheet
Years Ended December 31,
Managed Basis
Years Ended December 31,
Activity in Allowance for Private Education Loans
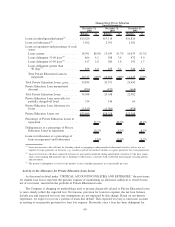
Allowance at beginning of period . . $ 886 $ 308 $ 204 $ 334 $ 86 $ 78 $ 1,220 $ 394 $ 282
Provision for Private Education
Loan losses . ............. 586 884 258 288 349 15 874 1,233 273
Charge-offs . ............. (460) (332) (160) (226) (107) (24) (686) (439) (184)
Recoveries . . ............. 36 32 23 9 — — 45 32 23
Net charge-offs. ............. (424) (300) (137) (217) (107) (24) (641) (407) (161)
Reclassification of interest
reserve
(1)
................ 38 — — 8 — — 46 — —
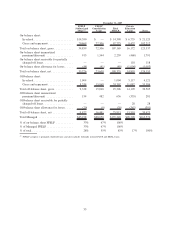
Balance before securitization of
Private Education Loans . . . . . . 1,086 892 325 413 328 69 1,499 1,220 394
Reduction for securitization of
Private Education Loans . . . . . . — (6) (17) — 6 17 — — —
Allowance at end of period . . . . . . $ 1,086 $ 886 $ 308 $ 413 $ 334 $ 86 $ 1,499 $ 1,220 $ 394
Net charge-offs as a percentage of
average loans in repayment . . . . 4.98% 5.04% 3.22% 2.68% 1.46% .43% 3.86% 3.07% 1.62%
Net charge-offs as a percentage of
average loans in repayment and
forbearance . ............. 4.39% 4.54% 2.99% 2.31% 1.27% .38% 3.37% 2.71% 1.47%
Allowance as a percentage of
ending total loans, gross . . . . . . 4.89% 5.48% 2.96% 3.02% 2.35% .65% 4.18% 4.02% 1.66%
Allowance as a percentage of
ending loans in repayment . . . . . 9.71% 12.57% 6.36% 4.34% 4.28% 1.26% 7.24% 8.21% 3.38%
Average coverage of net charge-
offs.................... 2.56 2.95 2.25 1.91 3.13 3.46 2.34 3.00 2.44
Ending total loans, gross ....... $22,203 $16,172 $10,428 $13,691 $14,199 $13,222 $35,894 $30,371 $23,650
Average loans in repayment . . . . . $ 8,533 $ 5,949 $ 4,257 $ 8,088 $ 7,305 $ 5,721 $16,621 $13,254 $ 9,978
Ending loans in repayment . . . . . . $11,182 $ 7,047 $ 4,851 $ 9,530 $ 7,819 $ 6,792 $20,712 $14,866 $11,643
(1)
Represents the additional allowance related to the amount of uncollectible interest reserved within interest income that is transferred in
the period to the allowance for loan losses when interest is capitalized to a loan’s principal balance. Prior to 2008, the interest provi-
sion was reversed in interest income and then provided for through provision within the allowance for loan loss. For the year ended
December 31, 2007, this amount was $21 million and $27 million on an On-Balance Sheet Basis and a Managed Basis, respectively,
and for the year ended December 31, 2006, this amount was $12 million and $15 million on an On-Balance Sheet Basis and a Man-
aged Basis, respectively.
62