Sallie Mae 2008 Annual Report Download - page 38
Download and view the complete annual report
Please find page 38 of the 2008 Sallie Mae annual report below. You can navigate through the pages in the report by either clicking on the pages listed below, or by using the keyword search tool below to find specific information within the annual report.-
 1
1 -
2
-
3
-
4
-
5
-
6
-
7
-
8
-
9
-
10
-
11
-
12
-
13
-
14
-
15
-
16
-
17
-
18
-
19
-
20
-
21
-
22
-
23
-
24
-
25
-
26
-
27
-
 28
28 -
 29
29 -
 30
30 -
 31
31 -
 32
32 -
 33
33 -
 34
34 -
 35
35 -
 36
36 -
 37
37 -
 38
38 -
 39
39 -
 40
40 -
 41
41 -
 42
42 -
 43
43 -
 44
44 -
 45
45 -
 46
46 -
 47
47 -
 48
48 -
49
-
50
-
51
-
52
-
53
-
54
-
55
-
56
-
57
-
58
-
59
-
60
-
61
-
62
-
63
-
64
-
65
-
66
-
67
-
68
-
69
-
70
-
71
-
72
-
73
-
74
-
75
-
76
-
77
-
78
-
79
-
80
-
81
-
82
-
83
-
84
-
85
-
86
-
87
-
88
-
89
-
90
-
91
-
92
-
93
-
94
-
95
-
96
-
97
-
98
-
99
-
100
-
101
-
102
-
103
-
104
-
105
-
106
-
107
-
108
-
109
-
110
-
111
-
112
-
113
-
114
-
115
-
116
-
117
-
118
-
119
-
120
-
121
-
122
-
123
-
124
-
125
-
126
-
127
-
128
-
129
-
130
-
131
-
132
-
133
-
134
-
135
-
136
-
137
-
138
-
139
-
140
-
141
-
142
-
143
-
144
-
145
-
146
-
147
-
148
-
149
-
150
-
151
-
152
-
153
-
154
-
155
-
156
-
157
-
158
-
159
-
160
-
161
-
162
-
163
-
164
-
165
-
166
-
167
-
168
-
169
-
170
-
171
-
172
-
173
-
174
-
175
-
176
-
177
-
178
-
179
-
180
-
181
-
182
-
183
-
184
-
185
-
186
-
187
-
188
-
189
-
190
-
191
-
192
-
193
-
194
-
195
-
196
-
197
-
198
-
199
-
200
-
201
-
202
-
203
-
204
-
205
-
206
-
207
-
208
-
209
-
210
-
211
-
212
-
213
-
214
-
215
-
216
-
217
-
218
-
219
-
220
-
221
-
222
-
223
-
224
-
225
-
226
-
227
-
228
-
229
-
230
-
231
-
232
-
233
-
234
-
235
-
236
-
237
-
238
-
239
-
240
 |
 |

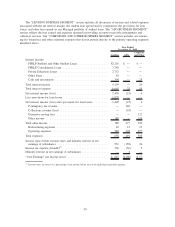
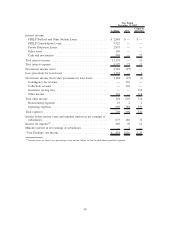
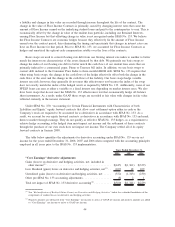
Residual Interests (see “LIQUIDITY AND CAPITAL RESOURCES — Residual Interest in Securitized
Receivables”).
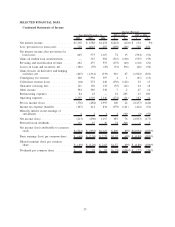
Net interest income after provisions for loan losses decreased by $594 million versus the year ended
December 31, 2006. The decrease was due to the year-over-year increase in the provisions for loan losses of
$728 million, which offset the year-over-year $134 million increase in net interest income. The increase in net
interest income was primarily due to an increase of $30.8 billion in the average balance of on-balance sheet
interest earning assets offset by a decrease in the student loan spread (see “LENDING BUSINESS
SEGMENT — Net Interest Income — Net Interest Margin-On-Balance Sheet—Student Loan Spread — On-
Balance Sheet”). The increase in provisions for loan losses relates to higher provision amounts for Private
Education Loans, FFELP loans, and mortgage loans primarily due to a weakening U.S. economy (see
“LENDING BUSINESS SEGMENT — Activity in the Allowance for Private Education Loan Losses; and —
Total Provisions for Loan Losses”).
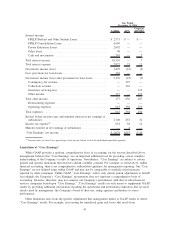
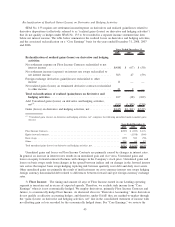
Fee and other income and collections revenue increased $42 million from $1.11 billion for the year ended
December 31, 2006 to $1.15 billion for the year ended December 31, 2007.
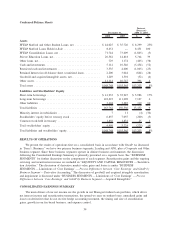
As noted above, we began restructuring our business in the fourth quarter of 2007 in response to the
impact of the CCRAA and current challenges in the capital markets. As part of our cost reduction efforts,
$23 million of severance costs related to the elimination of approximately 400 positions across all areas of the
Company were incurred in the fourth quarter of 2007.
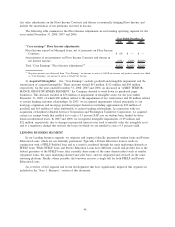
Operating expenses increased by $183 million year-over-year. This increase in operating expenses was
primarily due to $56 million in the Proposed Merger-related expenses incurred in 2007. Operating expenses in
2007 also included $93 million related to a full year of expenses for Upromise, acquired in August 2006,
compared to $33 million incurred in 2006.
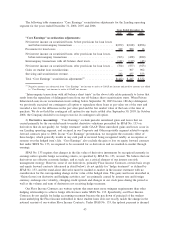
Our Managed student loan portfolio grew by $21.5 billion (or 15 percent), from $142.1 billion at
December 31, 2006 to $163.6 billion at December 31, 2007. In 2007 we acquired $40.3 billion of student
loans, an 8 percent increase over the $37.4 billion acquired in the year-ago period. The 2007 acquisitions
included $9.3 billion in Private Education Loans, an 11 percent increase over the $8.4 billion acquired in
2006. In the year ended December 31, 2007, we originated $25.2 billion of student loans through our Preferred
Channel, an increase of 8 percent over the $23.4 billion originated in the year-ago period.
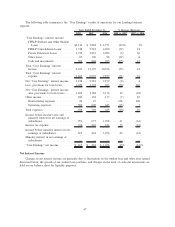
Other Income
The following table summarizes the components of “Other income” in the consolidated statements of
income for the years ended December 31, 2008, 2007 and 2006.
2008 2007 2006
Years Ended
December 31,
Late fees and forbearance fees ................................... $143 $136 $121
Asset servicing and other transaction fees .......................... 108 110 42
Loan servicing fees ........................................... 26 26 48
Gains on sales of mortgages and other loan fees...................... 3 11 15
Other ..................................................... 112 102 112
Total other income ........................................... $392 $385 $338
BUSINESS SEGMENTS
The results of operations of the Company’s Lending and APG operating segments are presented below.
These defined business segments operate in distinct business environments and are considered reportable
segments under SFAS No. 131, “Disclosures about Segments of an Enterprise and Related Information,” based
on quantitative thresholds applied to the Company’s financial statements. In addition, we provide other
complementary products and services, including guarantor and student loan servicing, through smaller
37