Sallie Mae 2008 Annual Report Download - page 105
Download and view the complete annual report
Please find page 105 of the 2008 Sallie Mae annual report below. You can navigate through the pages in the report by either clicking on the pages listed below, or by using the keyword search tool below to find specific information within the annual report.-
 1
1 -
2
-
3
-
4
-
5
-
6
-
7
-
8
-
9
-
10
-
11
-
12
-
13
-
14
-
15
-
16
-
17
-
18
-
19
-
20
-
21
-
22
-
23
-
24
-
25
-
26
-
27
-
28
-
29
-
30
-
31
-
32
-
33
-
34
-
35
-
36
-
37
-
38
-
39
-
40
-
41
-
42
-
43
-
44
-
45
-
46
-
47
-
48
-
49
-
50
-
51
-
52
-
53
-
54
-
55
-
56
-
57
-
58
-
59
-
60
-
61
-
62
-
63
-
64
-
65
-
66
-
67
-
68
-
69
-
70
-
71
-
72
-
73
-
74
-
75
-
76
-
77
-
78
-
79
-
80
-
81
-
82
-
83
-
84
-
85
-
86
-
87
-
88
-
89
-
90
-
91
-
92
-
93
-
94
-
 95
95 -
 96
96 -
 97
97 -
 98
98 -
 99
99 -
 100
100 -
 101
101 -
 102
102 -
 103
103 -
 104
104 -
 105
105 -
 106
106 -
 107
107 -
 108
108 -
 109
109 -
 110
110 -
 111
111 -
 112
112 -
 113
113 -
 114
114 -
 115
115 -
116
-
117
-
118
-
119
-
120
-
121
-
122
-
123
-
124
-
125
-
126
-
127
-
128
-
129
-
130
-
131
-
132
-
133
-
134
-
135
-
136
-
137
-
138
-
139
-
140
-
141
-
142
-
143
-
144
-
145
-
146
-
147
-
148
-
149
-
150
-
151
-
152
-
153
-
154
-
155
-
156
-
157
-
158
-
159
-
160
-
161
-
162
-
163
-
164
-
165
-
166
-
167
-
168
-
169
-
170
-
171
-
172
-
173
-
174
-
175
-
176
-
177
-
178
-
179
-
180
-
181
-
182
-
183
-
184
-
185
-
186
-
187
-
188
-
189
-
190
-
191
-
192
-
193
-
194
-
195
-
196
-
197
-
198
-
199
-
200
-
201
-
202
-
203
-
204
-
205
-
206
-
207
-
208
-
209
-
210
-
211
-
212
-
213
-
214
-
215
-
216
-
217
-
218
-
219
-
220
-
221
-
222
-
223
-
224
-
225
-
226
-
227
-
228
-
229
-
230
-
231
-
232
-
233
-
234
-
235
-
236
-
237
-
238
-
239
-
240
 |
 |
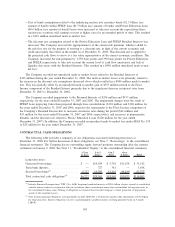
Credit Risk Management
We bear the full risk of loss on our Private Education Loan portfolio. These loans are underwritten and
priced according to risk, generally determined by a consumer credit scoring system, FICO. Because our
borrowers often have limited repayment history on other loan products and the addition of our loans increases
the debt burden of our borrowers, the origination of our loans generally results in an initial decrease in
borrowers’ FICO scores. After this initial decrease, borrowers’ FICO scores generally improve over time as
the financial positions of our borrowers become more established and their repayment history on all loans
becomes more seasoned. Additionally, for borrowers who do not meet our lending requirements or who desire
more favorable terms, we generally require credit-worthy cosigners.
We have defined underwriting and collection policies, and ongoing risk monitoring and review processes
for all Private Education Loans. Potential credit losses are considered in our risk-based pricing model. The
performance of the Private Education Loan portfolio may be affected by borrowers who fail to complete their
education and by the economy; a prolonged economic downturn may have an adverse effect on our credit
performance. This is taken into account when establishing allowances to cover the incurred losses.
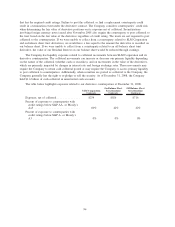
We have credit risk exposure to the various counterparties with whom we have entered into derivative
contracts. We review the credit standing of these companies. Our credit policies place limits on the amount of
exposure we may take with any one party and in most cases, require collateral to secure the position. The
credit risk associated with derivatives is measured based on the replacement cost should the counterparties
with contracts in a gain position to the Company fail to perform under the terms of the contract.
Credit risk in our investment portfolio is minimized by only investing in paper with highly rated issuers.
Additionally, limits per issuer are determined by our internal credit and investment guidelines to limit our
exposure to any one issuer. We also have credit risk with several higher education institutions related to
academic facilities loans secured by real estate.
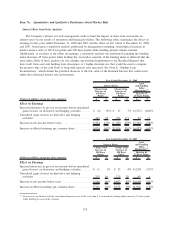
Market and Interest Rate Risk Management
We measure interest rate risk by calculating the variability of net interest income in future periods under
various interest rate scenarios using projected balances for interest-earning assets, interest-bearing liabilities
and derivatives used to hedge interest rate risk. Many assumptions are utilized by management to calculate the
impact that changes in interest rates may have on net interest income, the more significant of which are related
to student loan volumes and pricing, the timing of cash flows from our student loan portfolio, particularly the
impact of Floor Income and the rate of student loan consolidations, basis risk, credit spreads and the maturity
of our debt and derivatives.
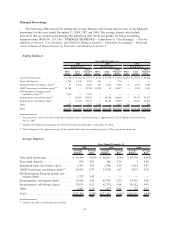
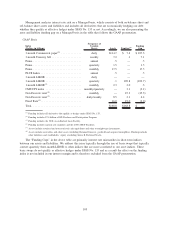
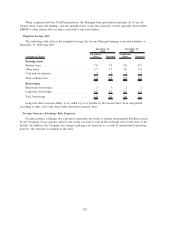
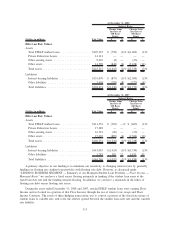
Asset and Liability Funding Gap
The tables below present our assets and liabilities (funding) arranged by underlying indices as of
December 31, 2008. In the following GAAP presentation, the funding gap only includes derivatives that
qualify as effective SFAS No. 133 hedges (those derivatives which are reflected in net interest margin, as
opposed to those reflected in the “gains/(losses) on derivatives and hedging activities, net” line on the income
statement). The difference between the asset and the funding is the funding gap for the specified index. This
represents our exposure to interest rate risk in the form of basis risk and repricing risk, which is the risk that
the different indices may reset at different frequencies or may not move in the same direction or at the same
magnitude.
104