Sallie Mae 2008 Annual Report Download - page 112
Download and view the complete annual report
Please find page 112 of the 2008 Sallie Mae annual report below. You can navigate through the pages in the report by either clicking on the pages listed below, or by using the keyword search tool below to find specific information within the annual report.-
 1
1 -
 2
2 -
 3
3 -
 4
4 -
 5
5 -
 6
6 -
 7
7 -
 8
8 -
 9
9 -
 10
10 -
 11
11 -
 12
12 -
 13
13 -
 14
14 -
 15
15 -
 16
16 -
 17
17 -
 18
18 -
 19
19 -
 20
20 -
 21
21 -
 22
22 -
 23
23 -
 24
24 -
 25
25 -
 26
26 -
 27
27 -
 28
28 -
 29
29 -
 30
30 -
 31
31 -
 32
32 -
 33
33 -
 34
34 -
 35
35 -
 36
36 -
 37
37 -
 38
38 -
 39
39 -
 40
40 -
 41
41 -
 42
42 -
 43
43 -
 44
44 -
 45
45 -
 46
46 -
 47
47 -
 48
48 -
 49
49 -
 50
50 -
 51
51 -
 52
52 -
 53
53 -
 54
54 -
 55
55 -
 56
56 -
 57
57 -
 58
58 -
 59
59 -
 60
60 -
 61
61 -
 62
62 -
 63
63 -
 64
64 -
 65
65 -
 66
66 -
 67
67 -
 68
68 -
 69
69 -
 70
70 -
 71
71 -
 72
72 -
 73
73 -
 74
74 -
 75
75 -
 76
76 -
 77
77 -
 78
78 -
 79
79 -
 80
80 -
 81
81 -
 82
82 -
 83
83 -
 84
84 -
 85
85 -
 86
86 -
 87
87 -
 88
88 -
 89
89 -
 90
90 -
 91
91 -
 92
92 -
 93
93 -
 94
94 -
 95
95 -
 96
96 -
 97
97 -
 98
98 -
 99
99 -
 100
100 -
 101
101 -
 102
102 -
 103
103 -
 104
104 -
 105
105 -
 106
106 -
 107
107 -
 108
108 -
 109
109 -
 110
110 -
 111
111 -
 112
112 -
 113
113 -
 114
114 -
 115
115 -
 116
116 -
 117
117 -
 118
118 -
 119
119 -
 120
120 -
 121
121 -
 122
122 -
 123
123 -
 124
124 -
 125
125 -
 126
126 -
 127
127 -
 128
128 -
 129
129 -
 130
130 -
 131
131 -
 132
132 -
 133
133 -
 134
134 -
 135
135 -
 136
136 -
 137
137 -
 138
138 -
 139
139 -
 140
140 -
 141
141 -
 142
142 -
 143
143 -
 144
144 -
 145
145 -
 146
146 -
 147
147 -
 148
148 -
 149
149 -
 150
150 -
 151
151 -
 152
152 -
 153
153 -
 154
154 -
 155
155 -
 156
156 -
 157
157 -
 158
158 -
 159
159 -
 160
160 -
 161
161 -
 162
162 -
 163
163 -
 164
164 -
 165
165 -
 166
166 -
 167
167 -
 168
168 -
 169
169 -
 170
170 -
 171
171 -
 172
172 -
 173
173 -
 174
174 -
 175
175 -
 176
176 -
 177
177 -
 178
178 -
 179
179 -
 180
180 -
 181
181 -
 182
182 -
 183
183 -
 184
184 -
 185
185 -
 186
186 -
 187
187 -
 188
188 -
 189
189 -
 190
190 -
 191
191 -
 192
192 -
 193
193 -
 194
194 -
 195
195 -
 196
196 -
 197
197 -
 198
198 -
 199
199 -
 200
200 -
 201
201 -
 202
202 -
 203
203 -
 204
204 -
 205
205 -
 206
206 -
 207
207 -
 208
208 -
 209
209 -
 210
210 -
 211
211 -
 212
212 -
 213
213 -
 214
214 -
 215
215 -
 216
216 -
 217
217 -
 218
218 -
 219
219 -
 220
220 -
 221
221 -
 222
222 -
 223
223 -
 224
224 -
 225
225 -
 226
226 -
 227
227 -
 228
228 -
 229
229 -
 230
230 -
 231
231 -
 232
232 -
 233
233 -
 234
234 -
 235
235 -
 236
236 -
 237
237 -
 238
238 -
 239
239 -
 240
240
 |
 |

(Dollars in millions) Fair Value $ % $ %
Change from
Increase of
100 Basis
Points
Change from
Increase of
300 Basis
Points
Interest Rates:
At December 31, 2008
Effect on Fair Values
Assets
Total FFELP student loans ................... $107,319 $ (758) (1)% $(1,602) (1)%
Private Education Loans ..................... 14,141 — — — —
Other earning assets ........................ 9,265 (9) — (25) —
Other assets . . ............................ 14,590 (848) (6) (2,108) (14)
Total assets . . ............................ $145,315 $(1,615) (1)% $(3,735) (3)%
Liabilities
Interest bearing liabilities .................... $135,070 $ (837) (1)% $(2,500) (2)%
Other liabilities ........................... 3,604 (293) (8) (273) (8)
Total liabilities ............................ $138,674 $(1,130) (1)% $(2,773) (2)%
(Dollars in millions) Fair Value $ % $ %
Change from
Increase of
100 Basis
Points
Change from
Increase of
300 Basis
Points
Interest Rates:
At December 31, 2007
Effect on Fair Values
Assets
Total FFELP student loans ................... $111,552 $ (303) —% $ (603) (1)%
Private Education Loans ..................... 17,289 — — — —
Other earning assets ........................ 16,321 (20) — (59) —
Other assets . . ............................ 15,092 (887) (6) (1,566) (10)
Total assets . . ............................ $160,254 $(1,210) (1)% $(2,228) (1)%
Liabilities
Interest bearing liabilities .................... $141,055 $(1,424) (1)% $(3,330) (2)%
Other liabilities ........................... 3,285 392 12 1,471 45
Total liabilities ............................ $144,340 $(1,032) (1)% $(1,859) (1)%
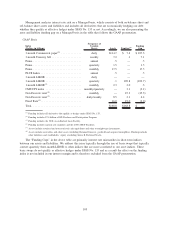
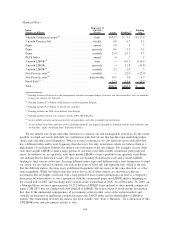
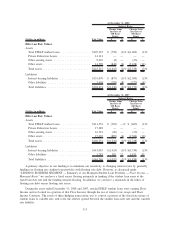
A primary objective in our funding is to minimize our sensitivity to changing interest rates by generally
funding our floating rate student loan portfolio with floating rate debt. However, as discussed under
“LENDING BUSINESS SEGMENT — Summary of our Managed Student Loan Portfolio — Floor Income —
Managed Basis,” we can have a fixed versus floating mismatch in funding if the student loan earns at the
fixed borrower rate and the funding remains floating. In addition, we can have a mismatch in the index of
floating rate debt versus floating rate assets.
During the years ended December 31, 2008 and 2007, certain FFELP student loans were earning Floor
Income and we locked in a portion of that Floor Income through the use of interest rate swaps and Floor
Income Contracts. The result of these hedging transactions was to convert a portion of the fixed rate nature of
student loans to variable rate, and to fix the relative spread between the student loan asset rate and the variable
rate liability.
111
