Sallie Mae 2008 Annual Report Download - page 47
Download and view the complete annual report
Please find page 47 of the 2008 Sallie Mae annual report below. You can navigate through the pages in the report by either clicking on the pages listed below, or by using the keyword search tool below to find specific information within the annual report.-
 1
1 -
2
-
3
-
4
-
5
-
6
-
7
-
8
-
9
-
10
-
11
-
12
-
13
-
14
-
15
-
16
-
17
-
18
-
19
-
20
-
21
-
22
-
23
-
24
-
25
-
26
-
27
-
28
-
29
-
30
-
31
-
32
-
33
-
34
-
35
-
36
-
 37
37 -
 38
38 -
 39
39 -
 40
40 -
 41
41 -
 42
42 -
 43
43 -
 44
44 -
 45
45 -
 46
46 -
 47
47 -
 48
48 -
 49
49 -
 50
50 -
 51
51 -
 52
52 -
 53
53 -
 54
54 -
 55
55 -
 56
56 -
 57
57 -
58
-
59
-
60
-
61
-
62
-
63
-
64
-
65
-
66
-
67
-
68
-
69
-
70
-
71
-
72
-
73
-
74
-
75
-
76
-
77
-
78
-
79
-
80
-
81
-
82
-
83
-
84
-
85
-
86
-
87
-
88
-
89
-
90
-
91
-
92
-
93
-
94
-
95
-
96
-
97
-
98
-
99
-
100
-
101
-
102
-
103
-
104
-
105
-
106
-
107
-
108
-
109
-
110
-
111
-
112
-
113
-
114
-
115
-
116
-
117
-
118
-
119
-
120
-
121
-
122
-
123
-
124
-
125
-
126
-
127
-
128
-
129
-
130
-
131
-
132
-
133
-
134
-
135
-
136
-
137
-
138
-
139
-
140
-
141
-
142
-
143
-
144
-
145
-
146
-
147
-
148
-
149
-
150
-
151
-
152
-
153
-
154
-
155
-
156
-
157
-
158
-
159
-
160
-
161
-
162
-
163
-
164
-
165
-
166
-
167
-
168
-
169
-
170
-
171
-
172
-
173
-
174
-
175
-
176
-
177
-
178
-
179
-
180
-
181
-
182
-
183
-
184
-
185
-
186
-
187
-
188
-
189
-
190
-
191
-
192
-
193
-
194
-
195
-
196
-
197
-
198
-
199
-
200
-
201
-
202
-
203
-
204
-
205
-
206
-
207
-
208
-
209
-
210
-
211
-
212
-
213
-
214
-
215
-
216
-
217
-
218
-
219
-
220
-
221
-
222
-
223
-
224
-
225
-
226
-
227
-
228
-
229
-
230
-
231
-
232
-
233
-
234
-
235
-
236
-
237
-
238
-
239
-
240
 |
 |

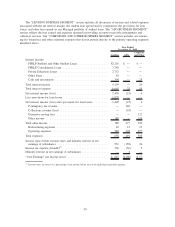
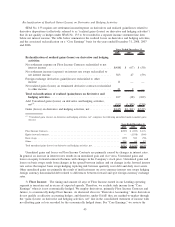
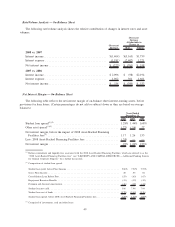
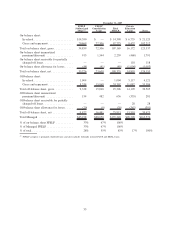
fair value adjustments on the Floor Income Contracts and futures economically hedging Floor Income and
include the amortization of net premiums received in income.
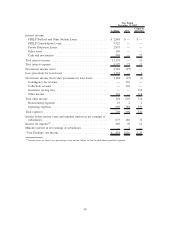
The following table summarizes the Floor Income adjustments in our Lending operating segment for the
years ended December 31, 2008, 2007 and 2006.
2008 2007 2006
Years Ended December 31,
“Core earnings” Floor Income adjustments:
Floor Income earned on Managed loans, net of payments on Floor Income
Contracts . . . ............................................ $ 69 $ — $ —
Amortization of net premiums on Floor Income Contracts and futures in
net interest income ........................................ (171) (169) $(209)
Total “Core Earnings” Floor Income adjustments
(1)
.................. $(102) $(169) $(209)
(1)
Negative amounts are subtracted from “Core Earnings” net income to arrive at GAAP net income and positive amounts are added
to “Core Earnings” net income to arrive at GAAP net income.
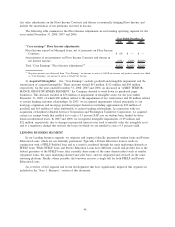
4) Acquired Intangibles: Our “Core Earnings” exclude goodwill and intangible impairment and the
amortization of acquired intangibles. These amounts totaled $91 million, $112 million and $94 million,
respectively, for the years ended December 31, 2008, 2007 and 2006. As discussed in “ASSET PERFOR-
MANCE GROUP BUSINESS SEGMENT,” the Company decided to wind down its purchased paper
businesses. This decision resulted in $36 million of impairment of intangible assets for the year ended
December 31, 2008, of which $28 million related to the impairment of two trade names and $8 million related
to certain banking customer relationships. In 2007, we recognized impairments related principally to our
mortgage origination and mortgage purchased paper businesses including approximately $20 million of
goodwill and $10 million of value attributable to certain banking relationships. In connection with our
acquisition of Southwest Student Services Corporation and Washington Transferee Corporation, we acquired
certain tax exempt bonds that enabled us to earn a 9.5 percent SAP rate on student loans funded by those
bonds in indentured trusts. In 2007 and 2006, we recognized intangible impairments of $9 million and
$21 million, respectively, due to changes in projected interest rates used to initially value the intangible asset
and to a regulatory change that restricts the loans on which we are entitled to earn a 9.5 percent yield.
LENDING BUSINESS SEGMENT
In our Lending business segment, we originate and acquire federally guaranteed student loans and Private
Education Loans, which are not federally guaranteed. Typically a Private Education Loan is made in
conjunction with a FFELP Stafford loan and as a result is marketed through the same marketing channels as
FFELP loans. While FFELP loans and Private Education Loans have different overall risk profiles due to the
federal guarantee of the FFELP loans, they currently share many of the same characteristics such as similar
repayment terms, the same marketing channel and sales force, and are originated and serviced on the same
servicing platform. Finally, where possible, the borrower receives a single bill for both FFELP and Private
Education Loans.
An overview of this segment and recent developments that have significantly impacted this segment are
included in the “Item 1. Business,” section of this document.
46