Sallie Mae 2008 Annual Report Download - page 66
Download and view the complete annual report
Please find page 66 of the 2008 Sallie Mae annual report below. You can navigate through the pages in the report by either clicking on the pages listed below, or by using the keyword search tool below to find specific information within the annual report.
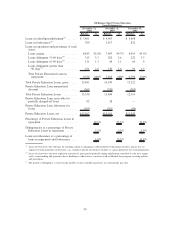
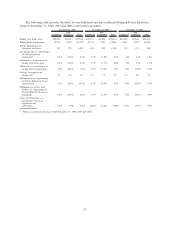
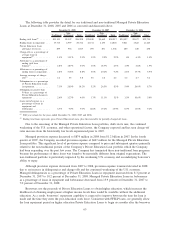
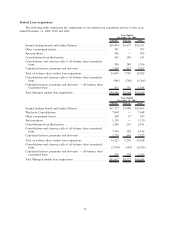
The following table provides the detail for our traditional and non-traditional Managed Private Education
Loans at December 31, 2008, 2007 and 2006 as corrected and discussed above.
Traditional
Non-
Traditional Total Traditional
Non-
Traditional Total Traditional
Non-
Traditional Total
December 31, 2008 December 31, 2007 December 31, 2006
Ending total loans
(2)
....... $31,101 $5,107 $36,208 $25,848 $4,669 $30,517 $20,037 $3,677 $23,714
Ending loans in repayment . . . 17,715 2,997 20,712 12,711 2,155 14,866 9,821 1,822 11,643
Private Education Loan
allowance for losses . . .... 859 954 1,813 495 871 1,366 209 249 458
Charge-offs as a percentage of
average loans in
repayment
(1)
........... 1.4% 11.1% 2.9% 1.2% 9.5% 2.5% .6% 6.3% 1.4%
Allowance as a percentage of
ending total loan
balance
(2)
............. 2.8% 18.7% 5.0% 1.9% 18.7% 4.5% 1.0% 6.8% 1.9%
Allowance as a percentage of
ending loans in repayment . . 4.8% 31.8% 8.8% 3.9% 40.4% 9.2% 2.1% 13.7% 3.9%
Average coverage of charge-
offs
(1)
............... 4.2 3.5 3.8 3.6 4.6 4.2 4.2 2.7 3.2
Delinquencies as a percentage
of Private Education Loans
in repayment. . ......... 7.1% 28.9% 10.2% 5.2% 26.3% 8.3% 5.4% 26.0% 8.7%
Delinquencies greater than
90 days as a percentage of
Private Education Loans in
repayment . . . ......... 2.6% 12.7% 4.0% 1.7% 11.1% 3.1% 1.5% 10.6% 3.0%
Loans in forbearance as a
percentage of loans in
repayment and
forbearance . . ......... 6.7% 9.0% 7.0% 12.8% 19.4% 13.9% 8.7% 11.9% 9.2%
(1)
Full year actuals for the years ended December 31, 2008, 2007 and 2006.
(2)
Ending total loans represents gross Private Education Loans, plus the receivable for partially charged-off loans.
Due to the seasoning of the Managed Private Education Loan portfolio, shifts in its mix, the continued
weakening of the U.S. economy, and other operational factors, the Company expected and has seen charge-off
rates increase from the historically low levels experienced prior to 2007.
Managed provision expense decreased to $874 million in 2008 from $1.2 billion in 2007. In the fourth
quarter of 2007, the Company recorded provision expense of $667 million for the Managed Private Education
Loan portfolio. This significant level of provision expense compared to prior and subsequent quarters primarily
related to the non-traditional portion of the Company’s Private Education Loan portfolio which the Company
had been expanding over the past few years. The Company has terminated these non-traditional loan programs
because the performance of these loans was found to be materially different from original expectations. The
non-traditional portfolio is particularly impacted by the weakening U.S. economy and an underlying borrower’s
ability to repay.
Although provision expense decreased from 2007 to 2008, provision expense remained elevated in 2008
due to an increase in delinquencies and charge-offs and the continued weakening of the U.S. economy.
Managed delinquencies as a percentage of Private Education Loans in repayment increased from 8.3 percent at
December 31, 2007 to 10.2 percent at December 31, 2008. Managed Private Education Loans in forbearance
as a percentage of loans in repayment and forbearance decreased from 13.9 percent at December 31, 2007 to
7.0 percent at December 31, 2008.
Borrowers use the proceeds of Private Education Loans to obtain higher education, which increases the
likelihood of obtaining employment at higher income levels than would be available without the additional
education. As a result, borrowers’ repayment capability is expected to improve between the time the loan is
made and the time they enter the post-education work force. Consistent with FFELP loans, we generally allow
the loan repayment period on higher education Private Education Loans to begin six months after the borrower
65


