Sallie Mae 2008 Annual Report Download - page 210
Download and view the complete annual report
Please find page 210 of the 2008 Sallie Mae annual report below. You can navigate through the pages in the report by either clicking on the pages listed below, or by using the keyword search tool below to find specific information within the annual report.-
 1
1 -
2
-
3
-
4
-
5
-
6
-
7
-
8
-
9
-
10
-
11
-
12
-
13
-
14
-
15
-
16
-
17
-
18
-
19
-
20
-
21
-
22
-
23
-
24
-
25
-
26
-
27
-
28
-
29
-
30
-
31
-
32
-
33
-
34
-
35
-
36
-
37
-
38
-
39
-
40
-
41
-
42
-
43
-
44
-
45
-
46
-
47
-
48
-
49
-
50
-
51
-
52
-
53
-
54
-
55
-
56
-
57
-
58
-
59
-
60
-
61
-
62
-
63
-
64
-
65
-
66
-
67
-
68
-
69
-
70
-
71
-
72
-
73
-
74
-
75
-
76
-
77
-
78
-
79
-
80
-
81
-
82
-
83
-
84
-
85
-
86
-
87
-
88
-
89
-
90
-
91
-
92
-
93
-
94
-
95
-
96
-
97
-
98
-
99
-
100
-
101
-
102
-
103
-
104
-
105
-
106
-
107
-
108
-
109
-
110
-
111
-
112
-
113
-
114
-
115
-
116
-
117
-
118
-
119
-
120
-
121
-
122
-
123
-
124
-
125
-
126
-
127
-
128
-
129
-
130
-
131
-
132
-
133
-
134
-
135
-
136
-
137
-
138
-
139
-
140
-
141
-
142
-
143
-
144
-
145
-
146
-
147
-
148
-
149
-
150
-
151
-
152
-
153
-
154
-
155
-
156
-
157
-
158
-
159
-
160
-
161
-
162
-
163
-
164
-
165
-
166
-
167
-
168
-
169
-
170
-
171
-
172
-
173
-
174
-
175
-
176
-
177
-
178
-
179
-
180
-
181
-
182
-
183
-
184
-
185
-
186
-
187
-
188
-
189
-
190
-
191
-
192
-
193
-
194
-
195
-
196
-
197
-
198
-
199
-
 200
200 -
 201
201 -
 202
202 -
 203
203 -
 204
204 -
 205
205 -
 206
206 -
 207
207 -
 208
208 -
 209
209 -
 210
210 -
 211
211 -
 212
212 -
 213
213 -
 214
214 -
 215
215 -
 216
216 -
 217
217 -
 218
218 -
 219
219 -
 220
220 -
221
-
222
-
223
-
224
-
225
-
226
-
227
-
228
-
229
-
230
-
231
-
232
-
233
-
234
-
235
-
236
-
237
-
238
-
239
-
240
 |
 |

19. Income Taxes (Continued)
investor. In addition, during the third quarter of 2007, the Company filed an administrative-level appeal related
to one unagreed item originating from the Company’s 2004 U.S. federal tax return. The IRS is also currently
examining the Company’s 2005 and 2006 federal income tax returns. It is reasonably possible that there will
be a decrease in the Company’s unrecognized tax benefits as a result of the resolution of these items. When
considering both tax and interest amounts, the decrease could be approximately $12 million to $18 million.
In the event that the Company is not contacted for exam by additional tax authorities by the end of 2009,
it is reasonably possible that there will be a decrease in the Company’s unrecognized tax benefits as a result
of the lapse of various statute of limitations periods. When considering both tax and interest amounts, the
decrease could be approximately $2 million to $5 million.
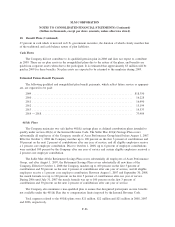
Tax Years Remaining Subject to Exam
The Company or one of its subsidiaries files income tax returns at the U.S. federal level, in most
U.S. states, and various foreign jurisdictions. U.S. federal income tax returns filed for years prior to 2003 have
been audited and are now resolved. As shown in the table below, the Company’s primary operating subsidiary
has been audited by the listed states through the year shown, again with all issues resolved. Other
combinations of subsidiaries, tax years, and jurisdictions remain open for review, subject to statute of
limitations periods (typically 3 to 4 prior years).
State Year audited through
Florida ....................................................... 2000
Indiana....................................................... 2000
Pennsylvania . ................................................. 2000
California ..................................................... 2002
Missouri...................................................... 2003
NewYork..................................................... 2004
North Carolina ................................................. 2005
Texas........................................................ 2004
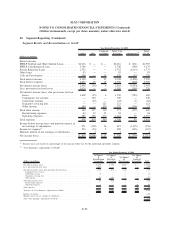
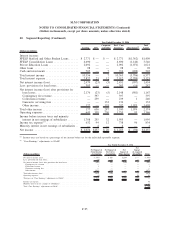
20. Segment Reporting
The Company has two primary operating segments as defined in SFAS No. 131, the Lending operating
segment and the APG (formerly known as DMO) operating segment. The Lending and APG operating
segments meet the quantitative thresholds for reportable segments identified in SFAS No. 131. Accordingly,
the results of operations of the Company’s Lending and APG reportable segments are presented below. The
Company has smaller operating segments including the Guarantor Servicing, Loan Servicing, and Upromise
operating segments, as well as certain other products and services provided to colleges and universities which
do not meet the quantitative thresholds identified in SFAS No. 131. Therefore, the results of operations for
these operating segments and the revenues and expenses associated with these other products and services are
combined with corporate overhead and other corporate activities within the Corporate and Other reportable
segment.
The management reporting process measures the performance of the Company’s operating segments
based on the management structure of the Company as well as the methodology used by management to
evaluate performance and allocate resources. Management, including the Company’s chief operating decision
makers, evaluates the performance of the Company’s operating segments based on their profitability. As
discussed further below, management measures the profitability of the Company’s operating segments based
F-90
SLM CORPORATION
NOTES TO CONSOLIDATED FINANCIAL STATEMENTS (Continued)
(Dollars in thousands, except per share amounts, unless otherwise stated)