Sallie Mae 2008 Annual Report Download - page 107
Download and view the complete annual report
Please find page 107 of the 2008 Sallie Mae annual report below. You can navigate through the pages in the report by either clicking on the pages listed below, or by using the keyword search tool below to find specific information within the annual report.-
 1
1 -
2
-
3
-
4
-
5
-
6
-
7
-
8
-
9
-
10
-
11
-
12
-
13
-
14
-
15
-
16
-
17
-
18
-
19
-
20
-
21
-
22
-
23
-
24
-
25
-
26
-
27
-
28
-
29
-
30
-
31
-
32
-
33
-
34
-
35
-
36
-
37
-
38
-
39
-
40
-
41
-
42
-
43
-
44
-
45
-
46
-
47
-
48
-
49
-
50
-
51
-
52
-
53
-
54
-
55
-
56
-
57
-
58
-
59
-
60
-
61
-
62
-
63
-
64
-
65
-
66
-
67
-
68
-
69
-
70
-
71
-
72
-
73
-
74
-
75
-
76
-
77
-
78
-
79
-
80
-
81
-
82
-
83
-
84
-
85
-
86
-
87
-
88
-
89
-
90
-
91
-
92
-
93
-
94
-
95
-
96
-
 97
97 -
 98
98 -
 99
99 -
 100
100 -
 101
101 -
 102
102 -
 103
103 -
 104
104 -
 105
105 -
 106
106 -
 107
107 -
 108
108 -
 109
109 -
 110
110 -
 111
111 -
 112
112 -
 113
113 -
 114
114 -
 115
115 -
 116
116 -
 117
117 -
118
-
119
-
120
-
121
-
122
-
123
-
124
-
125
-
126
-
127
-
128
-
129
-
130
-
131
-
132
-
133
-
134
-
135
-
136
-
137
-
138
-
139
-
140
-
141
-
142
-
143
-
144
-
145
-
146
-
147
-
148
-
149
-
150
-
151
-
152
-
153
-
154
-
155
-
156
-
157
-
158
-
159
-
160
-
161
-
162
-
163
-
164
-
165
-
166
-
167
-
168
-
169
-
170
-
171
-
172
-
173
-
174
-
175
-
176
-
177
-
178
-
179
-
180
-
181
-
182
-
183
-
184
-
185
-
186
-
187
-
188
-
189
-
190
-
191
-
192
-
193
-
194
-
195
-
196
-
197
-
198
-
199
-
200
-
201
-
202
-
203
-
204
-
205
-
206
-
207
-
208
-
209
-
210
-
211
-
212
-
213
-
214
-
215
-
216
-
217
-
218
-
219
-
220
-
221
-
222
-
223
-
224
-
225
-
226
-
227
-
228
-
229
-
230
-
231
-
232
-
233
-
234
-
235
-
236
-
237
-
238
-
239
-
240
 |
 |

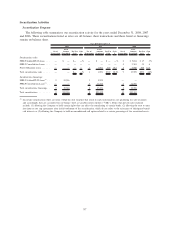
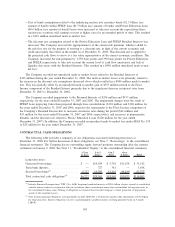
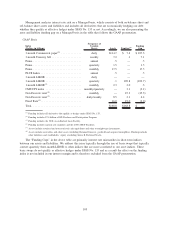
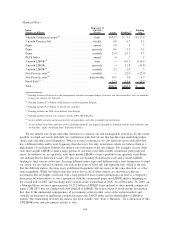
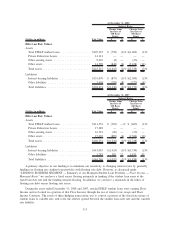
Managed Basis
Index
(Dollars in billions)
Frequency of
Variable
Resets Assets Funding
(1)
Funding
Gap
3 month Commercial paper
(2)
................. daily $134.7 $ 7.5 $ 127.2
3 month Treasury bill ....................... weekly 9.8 6.7 3.1
Prime ................................... annual 1.0 .3 .7
Prime ................................... quarterly 6.6 3.5 3.1
Prime ................................... monthly 25.0 15.3 9.7
PLUS Index .............................. annual .6 .1 .5
3-month LIBOR
(3)
......................... daily — 116.1 (116.1)
3-month LIBOR ........................... quarterly — 11.8 (11.8)
1-month LIBOR
(4)
......................... monthly 2.3 2.0 .3
Non Discrete reset
(5)
........................ monthly — 22.0 (22.0)
Non Discrete reset
(6)
........................ daily/weekly 10.1 1.6 8.5
Fixed Rate
(7)
............................. 12.4 15.6 (3.2)
Total ................................... $202.5 $202.5 $ —
(1)
Funding includes all derivatives that management considers economic hedges of interest rate risk and reflects how we internally
manage our interest rate exposure.
(2)
Funding includes $7.4 billion of ED Purchase and Participation Program.
(3)
Funding includes $2.5 billion of auction rate securities.
(4)
Funding includes the 2008 Asset-Backed Loan Facility.
(5)
Funding includes auction rate securities and the 2008 ABCP Facility.
(6)
Assets include restricted and non-restricted cash equivalents and other overnight-type instruments.
(7)
Assets include receivables and other assets (including goodwill and acquired intangibles). Funding includes other liabilities and
stockholders’ equity (excluding Series B Preferred Stock).
We use interest rate swaps and other derivatives to achieve our risk management objectives. To the extent
possible, we fund our assets with debt (in combination with derivatives) that has the same underlying index
(index type and index reset frequency). When it is more economical, we also fund our assets with debt that
has a different index and/or reset frequency than the asset, but only in instances where we believe there is a
high degree of correlation between the interest rate movement of the two indices. For example, we use daily
reset three-month LIBOR to fund a large portion of our daily reset three-month commercial paper indexed
assets. In addition, we use quarterly reset three-month LIBOR to fund a portion of our quarterly reset Prime
rate indexed Private Education Loans. We also use our monthly Non Discrete reset and 1-month LIBOR
funding to fund various asset types. In using different index types and different index reset frequencies to fund
our assets, we are exposed to interest rate risk in the form of basis risk and repricing risk, which is the risk
that the different indices that may reset at different frequencies will not move in the same direction or at the
same magnitude. While we believe that this risk is low as all of these indices are short-term with rate
movements that are highly correlated over a long period of time, market disruptions can lead to a temporary
divergence between indices as was experienced with the commercial paper and LIBOR indices beginning in
the second half of 2007 and becoming more volatile in the second half of 2008. As of December 31, 2008, on
a Managed Basis, we have approximately $127.2 billion of FFELP loans indexed to three-month commercial
paper (“3M CP”) that are funded with debt indexed to LIBOR. We believe there is broad market recognition
that, due to the unintended consequences of government action in other areas of the capital markets and
virtually no issuances of qualifying commercial paper, the 3M CP index and its relationship to LIBOR is
broken. The relationship between the indices has been volatile. See “Item 1. Business,” for a discussion of this
CP/LIBOR issue and government actions to date.
106