Sallie Mae 2008 Annual Report Download - page 57
Download and view the complete annual report
Please find page 57 of the 2008 Sallie Mae annual report below. You can navigate through the pages in the report by either clicking on the pages listed below, or by using the keyword search tool below to find specific information within the annual report.-
 1
1 -
2
-
3
-
4
-
5
-
6
-
7
-
8
-
9
-
10
-
11
-
12
-
13
-
14
-
15
-
16
-
17
-
18
-
19
-
20
-
21
-
22
-
23
-
24
-
25
-
26
-
27
-
28
-
29
-
30
-
31
-
32
-
33
-
34
-
35
-
36
-
37
-
38
-
39
-
40
-
41
-
42
-
43
-
44
-
45
-
46
-
 47
47 -
 48
48 -
 49
49 -
 50
50 -
 51
51 -
 52
52 -
 53
53 -
 54
54 -
 55
55 -
 56
56 -
 57
57 -
 58
58 -
 59
59 -
 60
60 -
 61
61 -
 62
62 -
 63
63 -
 64
64 -
 65
65 -
 66
66 -
 67
67 -
68
-
69
-
70
-
71
-
72
-
73
-
74
-
75
-
76
-
77
-
78
-
79
-
80
-
81
-
82
-
83
-
84
-
85
-
86
-
87
-
88
-
89
-
90
-
91
-
92
-
93
-
94
-
95
-
96
-
97
-
98
-
99
-
100
-
101
-
102
-
103
-
104
-
105
-
106
-
107
-
108
-
109
-
110
-
111
-
112
-
113
-
114
-
115
-
116
-
117
-
118
-
119
-
120
-
121
-
122
-
123
-
124
-
125
-
126
-
127
-
128
-
129
-
130
-
131
-
132
-
133
-
134
-
135
-
136
-
137
-
138
-
139
-
140
-
141
-
142
-
143
-
144
-
145
-
146
-
147
-
148
-
149
-
150
-
151
-
152
-
153
-
154
-
155
-
156
-
157
-
158
-
159
-
160
-
161
-
162
-
163
-
164
-
165
-
166
-
167
-
168
-
169
-
170
-
171
-
172
-
173
-
174
-
175
-
176
-
177
-
178
-
179
-
180
-
181
-
182
-
183
-
184
-
185
-
186
-
187
-
188
-
189
-
190
-
191
-
192
-
193
-
194
-
195
-
196
-
197
-
198
-
199
-
200
-
201
-
202
-
203
-
204
-
205
-
206
-
207
-
208
-
209
-
210
-
211
-
212
-
213
-
214
-
215
-
216
-
217
-
218
-
219
-
220
-
221
-
222
-
223
-
224
-
225
-
226
-
227
-
228
-
229
-
230
-
231
-
232
-
233
-
234
-
235
-
236
-
237
-
238
-
239
-
240
 |
 |

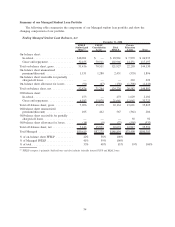
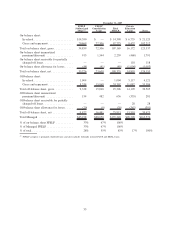
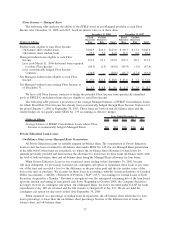
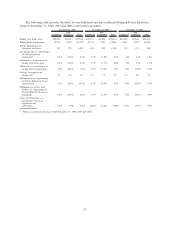
Student Loan Average Balances (net of unamortized premium/discount)
The following tables summarize the components of our Managed student loan portfolio and show the
changing composition of our portfolio.
FFELP
Stafford and
Other
(1)
FFELP
Consolidation
Loans Total FFELP
Private
Education
Loans Total
Year Ended December 31, 2008
On-balance sheet . . . . . . . . . . . . . . . . . . . $44,291 $73,091 $117,382 $19,276 $136,658
Off-balance sheet. . . . . . . . . . . . . . . . . . . 8,299 15,966 24,265 13,321 37,586
Total Managed . . . . . . . . . . . . . . . . . . . . $52,590 $89,057 $141,647 $32,597 $174,244
% of on-balance sheet FFELP . . . . . . . . . . 38% 62% 100%
% of Managed FFELP . . . . . . . . . . . . . . . 37% 63% 100%
% of total . . . . . . . . . . . . . . . . . . . . . . . . 30% 51% 81% 19% 100%
FFELP
Stafford and
Other
(1)
FFELP
Consolidation
Loans Total FFELP
Private
Education
Loans Total
Year Ended December 31, 2007
On-balance sheet . . . . . . . . . . . . . . . . . . . $31,294 $67,918 $ 99,212 $12,507 $111,719
Off-balance sheet. . . . . . . . . . . . . . . . . . . 11,533 17,195 28,728 13,683 42,411
Total Managed . . . . . . . . . . . . . . . . . . . . $42,827 $85,113 $127,940 $26,190 $154,130
% of on-balance sheet FFELP . . . . . . . . . . 32% 68% 100%
% of Managed FFELP . . . . . . . . . . . . . . . 33% 67% 100%
% of total . . . . . . . . . . . . . . . . . . . . . . . . 28% 55% 83% 17% 100%
FFELP
Stafford and
Other
(1)
FFELP
Consolidation
Loans Total FFELP
Private
Education
Loans Total
Year Ended December 31, 2006
On-balance sheet . . . . . . . . . . . . . . . . . . . $21,152 $55,119 $ 76,271 $ 8,585 $ 84,856
Off-balance sheet. . . . . . . . . . . . . . . . . . . 19,546 15,652 35,198 11,138 46,336
Total Managed . . . . . . . . . . . . . . . . . . . . $40,698 $70,771 $111,469 $19,723 $131,192
% of on-balance sheet FFELP . . . . . . . . . . 28% 72% 100%
% of Managed FFELP . . . . . . . . . . . . . . . 37% 63% 100%
% of total . . . . . . . . . . . . . . . . . . . . . . . . 31% 54% 85% 15% 100%
(1)
FFELP category is primarily Stafford loans and also includes federally insured PLUS and HEAL loans.
56