Sallie Mae 2008 Annual Report Download - page 49
Download and view the complete annual report
Please find page 49 of the 2008 Sallie Mae annual report below. You can navigate through the pages in the report by either clicking on the pages listed below, or by using the keyword search tool below to find specific information within the annual report.-
 1
1 -
2
-
3
-
4
-
5
-
6
-
7
-
8
-
9
-
10
-
11
-
12
-
13
-
14
-
15
-
16
-
17
-
18
-
19
-
20
-
21
-
22
-
23
-
24
-
25
-
26
-
27
-
28
-
29
-
30
-
31
-
32
-
33
-
34
-
35
-
36
-
37
-
38
-
 39
39 -
 40
40 -
 41
41 -
 42
42 -
 43
43 -
 44
44 -
 45
45 -
 46
46 -
 47
47 -
 48
48 -
 49
49 -
 50
50 -
 51
51 -
 52
52 -
 53
53 -
 54
54 -
 55
55 -
 56
56 -
 57
57 -
 58
58 -
 59
59 -
60
-
61
-
62
-
63
-
64
-
65
-
66
-
67
-
68
-
69
-
70
-
71
-
72
-
73
-
74
-
75
-
76
-
77
-
78
-
79
-
80
-
81
-
82
-
83
-
84
-
85
-
86
-
87
-
88
-
89
-
90
-
91
-
92
-
93
-
94
-
95
-
96
-
97
-
98
-
99
-
100
-
101
-
102
-
103
-
104
-
105
-
106
-
107
-
108
-
109
-
110
-
111
-
112
-
113
-
114
-
115
-
116
-
117
-
118
-
119
-
120
-
121
-
122
-
123
-
124
-
125
-
126
-
127
-
128
-
129
-
130
-
131
-
132
-
133
-
134
-
135
-
136
-
137
-
138
-
139
-
140
-
141
-
142
-
143
-
144
-
145
-
146
-
147
-
148
-
149
-
150
-
151
-
152
-
153
-
154
-
155
-
156
-
157
-
158
-
159
-
160
-
161
-
162
-
163
-
164
-
165
-
166
-
167
-
168
-
169
-
170
-
171
-
172
-
173
-
174
-
175
-
176
-
177
-
178
-
179
-
180
-
181
-
182
-
183
-
184
-
185
-
186
-
187
-
188
-
189
-
190
-
191
-
192
-
193
-
194
-
195
-
196
-
197
-
198
-
199
-
200
-
201
-
202
-
203
-
204
-
205
-
206
-
207
-
208
-
209
-
210
-
211
-
212
-
213
-
214
-
215
-
216
-
217
-
218
-
219
-
220
-
221
-
222
-
223
-
224
-
225
-
226
-
227
-
228
-
229
-
230
-
231
-
232
-
233
-
234
-
235
-
236
-
237
-
238
-
239
-
240
 |
 |

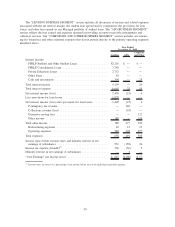
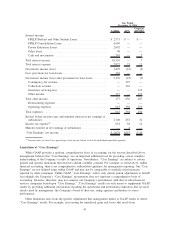
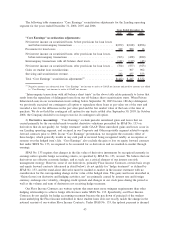
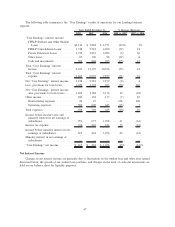
Average Balance Sheets — On-Balance Sheet
The following table reflects the rates earned on interest-earning assets and paid on interest-bearing
liabilities for the years ended December 31, 2008, 2007 and 2006. This table reflects the net interest margin
for the entire Company for our on-balance sheet assets. It is included in the Lending business segment
discussion because the Lending business segment includes substantially all interest-earning assets and interest-
bearing liabilities.
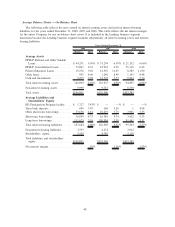
Balance Rate Balance Rate Balance Rate
2008 2007 2006
Years Ended December 31,
Average Assets
FFELP Stafford and Other Student
Loans ...................... $ 44,291 4.50% $ 31,294 6.59% $ 21,152 6.66%
FFELP Consolidation Loans ....... 73,091 4.35 67,918 6.39 55,119 6.43
Private Education Loans .......... 19,276 9.01 12,507 11.65 8,585 11.90
Other loans .................... 955 8.66 1,246 8.49 1,155 8.48
Cash and investments ............ 9,279 2.98 12,710 5.57 8,824 5.70
Total interest-earning assets ........ 146,892 4.95% 125,675 6.90% 94,835 6.94%
Non-interest-earning assets ........ 9,999 9,715 8,550
Total assets .................... $156,891 $135,390 $103,385
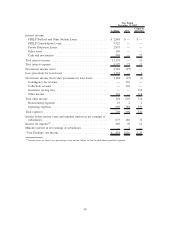
Average Liabilities and
Stockholders’ Equity
ED Participation Program facility . . . $ 1,727 3.43% $ — —% $ — —%
Term bank deposits .............. 696 3.95 166 5.26 1 4.98
Other short-term borrowings ....... 33,636 4.81 16,219 5.75 3,901 5.33
Short-term borrowings............ 36,059 4.73 16,385 5.74 3,902 5.33
Long-term borrowings ............ 111,625 3.76 109,984 5.59 91,461 5.37
Total interest-bearing liabilities ..... 147,684 4.00% 126,369 5.61% 95,363 5.37%
Non-interest-bearing liabilities ...... 3,797 4,272 3,912
Stockholders’ equity ............. 5,410 4,749 4,110
Total liabilities and stockholders’
equity ...................... $156,891 $135,390 $103,385
Net interest margin .............. .93% 1.26% 1.53%
48