Sallie Mae 2008 Annual Report Download - page 79
Download and view the complete annual report
Please find page 79 of the 2008 Sallie Mae annual report below. You can navigate through the pages in the report by either clicking on the pages listed below, or by using the keyword search tool below to find specific information within the annual report.-
 1
1 -
2
-
3
-
4
-
5
-
6
-
7
-
8
-
9
-
10
-
11
-
12
-
13
-
14
-
15
-
16
-
17
-
18
-
19
-
20
-
21
-
22
-
23
-
24
-
25
-
26
-
27
-
28
-
29
-
30
-
31
-
32
-
33
-
34
-
35
-
36
-
37
-
38
-
39
-
40
-
41
-
42
-
43
-
44
-
45
-
46
-
47
-
48
-
49
-
50
-
51
-
52
-
53
-
54
-
55
-
56
-
57
-
58
-
59
-
60
-
61
-
62
-
63
-
64
-
65
-
66
-
67
-
68
-
 69
69 -
 70
70 -
 71
71 -
 72
72 -
 73
73 -
 74
74 -
 75
75 -
 76
76 -
 77
77 -
 78
78 -
 79
79 -
 80
80 -
 81
81 -
 82
82 -
 83
83 -
 84
84 -
 85
85 -
 86
86 -
 87
87 -
 88
88 -
 89
89 -
90
-
91
-
92
-
93
-
94
-
95
-
96
-
97
-
98
-
99
-
100
-
101
-
102
-
103
-
104
-
105
-
106
-
107
-
108
-
109
-
110
-
111
-
112
-
113
-
114
-
115
-
116
-
117
-
118
-
119
-
120
-
121
-
122
-
123
-
124
-
125
-
126
-
127
-
128
-
129
-
130
-
131
-
132
-
133
-
134
-
135
-
136
-
137
-
138
-
139
-
140
-
141
-
142
-
143
-
144
-
145
-
146
-
147
-
148
-
149
-
150
-
151
-
152
-
153
-
154
-
155
-
156
-
157
-
158
-
159
-
160
-
161
-
162
-
163
-
164
-
165
-
166
-
167
-
168
-
169
-
170
-
171
-
172
-
173
-
174
-
175
-
176
-
177
-
178
-
179
-
180
-
181
-
182
-
183
-
184
-
185
-
186
-
187
-
188
-
189
-
190
-
191
-
192
-
193
-
194
-
195
-
196
-
197
-
198
-
199
-
200
-
201
-
202
-
203
-
204
-
205
-
206
-
207
-
208
-
209
-
210
-
211
-
212
-
213
-
214
-
215
-
216
-
217
-
218
-
219
-
220
-
221
-
222
-
223
-
224
-
225
-
226
-
227
-
228
-
229
-
230
-
231
-
232
-
233
-
234
-
235
-
236
-
237
-
238
-
239
-
240
 |
 |

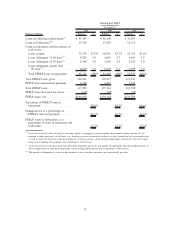
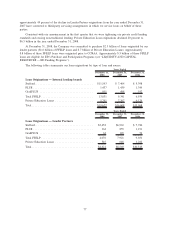
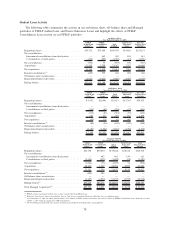
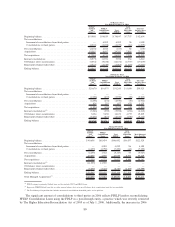
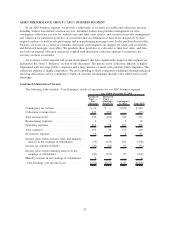
Student Loan Activity
The following tables summarize the activity in our on-balance sheet, off-balance sheet and Managed
portfolios of FFELP student loans and Private Education Loans and highlight the effects of FFELP
Consolidation Loan activity on our FFELP portfolios.
FFELP
Stafford and
Other
(1)
FFELP
Consolidation
Loans
Total
FFELP
Total Private
Education
Loans
Total On-
Balance Sheet
Portfolio
On-Balance Sheet
Year Ended December 31, 2008
Beginning balance . ........................... $35,726 $73,609 $109,335 $14,818 $124,153
Net consolidations:
Incremental consolidations from third parties . . ....... — 462 462 149 611
Consolidations to third parties . . ................. (703) (392) (1,095) (41) (1,136)
Net consolidations . ........................... (703) 70 (633) 108 (525)
Acquisitions ................................ 21,889 1,358 23,247 7,357 30,604
Net acquisitions . . ........................... 21,186 1,428 22,614 7,465 30,079
Internal consolidations
(2)
........................ (409) 529 120 228 348
Off-balance sheet securitizations . . ................. — — — — —
Repayments/claims/resales/other . . ................. (4,027) (3,822) (7,849) (1,929) (9,778)
Ending balance . . . ........................... $52,476 $71,744 $124,220 $20,582 $144,802
FFELP
Stafford and
Other
(1)
FFELP
Consolidation
Loans
Total
FFELP
Total Private
Education
Loans
Total Off-
Balance Sheet
Portfolio
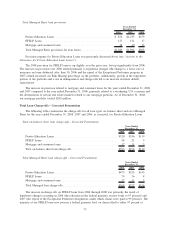
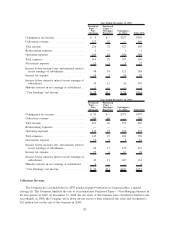
Off-Balance Sheet
Year Ended December 31, 2008
Beginning balance ............................. $9,472 $16,441 $25,913 $13,510 $39,423
Net consolidations:
Incremental consolidations from third parties .......... — — — — —
Consolidations to third parties ................... (311) (83) (394) (57) (451)
Net consolidations ............................. (311) (83) (394) (57) (451)
Acquisitions . . . .............................. 246 211 457 742 1,199
Net acquisitions .............................. (65) 128 63 685 748
Internal consolidations
(2)
......................... (84) (36) (120) (228) (348)
Off-balance sheet securitizations ................... — — — — —
Repayments/claims/resales/other .................... (2,180) (1,002) (3,182) (1,050) (4,232)
Ending balance . .............................. $7,143 $15,531 $22,674 $12,917 $35,591
FFELP
Stafford and
Other
(1)
FFELP
Consolidation
Loans
Total
FFELP
Total Private
Education
Loans
Total
Managed Basis
Portfolio
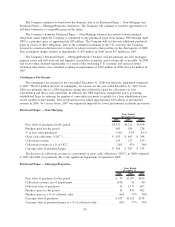
Managed Portfolio
Year Ended December 31, 2008
Beginning balance ........................... $45,198 $90,050 $135,248 $28,328 $163,576
Net consolidations:
Incremental consolidations from third parties ........ — 462 462 149 611
Consolidations to third parties .................. (1,014) (475) (1,489) (98) (1,587)
Net consolidations ........................... (1,014) (13) (1,027) 51 (976)
Acquisitions . . . ............................ 22,135 1,569 23,704 8,099 31,803
Net acquisitions . ............................ 21,121 1,556 22,677 8,150 30,827
Internal consolidations
(2)
....................... (493) 493 — — —
Off-balance sheet securitizations .................. — — — — —
Repayments/claims/resales/other .................. (6,207) (4,824) (11,031) (2,979) (14,010)
Ending balance
(3)
............................ $59,619 $87,275 $146,894 $33,499 $180,393
Total Managed Acquisitions
(4)
.................... $22,135 $ 2,031 $ 24,166 $ 8,248 $ 32,414
(1)
FFELP category is primarily Stafford loans and also includes PLUS and HEAL loans.
(2)
Represents loans that we either own on-balance sheet or loans that we consolidated from our off-balance sheet securitization trusts.
(3)
As of December 31, 2008, the ending balance includes $13.7 billion of FFELP Stafford and Other Loans and $2.6 billion of FFELP Consolidation Loans disbursed on or after
October 1, 2007, which are impacted by CCRAA legislation.
(4)
The Total Managed Acquisitions line includes incremental consolidations from third parties and acquisitions.
78